Uber’s Electrification Update
"Our ambitious efforts to transition to a zero-emission mobility platform have seen meaningful progress. Today, Uber is the world’s most widely available platform for zero-emission rides, with drivers adopting EVs up to 5 times faster than average motorists in the US, Canada, and Europe."
Rebecca Tinucci, Global Head of Electrification and Sustainability, Uber
Q1 2025 Update: This page includes metrics for trips completed on Uber by internal combustion engine (ICE) vehicles and zero-emission vehicles (ZEVs, such as battery EVs) from the beginning of the first quarter of 2021 to the end of the first quarter of 2025. Note that the scope of this report includes only Uber’s Mobility business (ridesharing).

Tracking our journey to zero emissions
Five years into our ambitious effort to transition to a zero-emission platform, we’ve made meaningful progress. Today, Uber is the world's most widely available platform for zero-emission rides, with drivers adopting EVs (electric vehicles) up to 5 times faster than average motorists in the US, Canada, and Europe.
We’ve invested hundreds of millions of dollars to help interested drivers make the switch to electric through incentives, partnerships, and product enhancements—and it’s paying off. Increasingly, riders are experiencing their first EV on Uber, helping to normalize and accelerate the adoption of electric transport all over the world.
Our data shows that EV progress quickens when government and industry work together to get the economics right. In cities like London, Vancouver, and Amsterdam, where thoughtful policies, industry investment, and strong charging networks align, more than 1 in every 3 miles on Uber are now electric.
Despite this significant progress, major barriers remain to fully achieve our goals. High upfront EV costs, limited charging access, and inconsistent policy support continue to slow adoption. Based on current trends, we cannot meet our remaining mobility and delivery goals for 2025, and our 2030 goals will be out of reach without stronger, coordinated action across government and industry.
As we’ve said from the start: climate is a team sport, and progress depends on collective action. That’s why we’re increasingly prioritizing efforts in cities where public and private investment are aligned.
While many key levers are outside our control, we remain deeply committed to this transition—not just because it’s the right thing to do, but also because it brings direct and strategic business benefits. Thousands of drivers around the world are taking home more money thanks to lower EV operating costs and rider demand for electric vehicles. Riders report higher satisfaction with the EV experience and are increasingly choosing EVs.
And finally, the future is shared, electric, and autonomous—and the coming wave of autonomous (electric) vehicles will create a major tailwind in achieving our sustainability goals.
Our latest update below outlines the progress to date, key insights, and areas of focus for 2025 and beyond.
__
Rebecca Tinucci, Global Head of Electrification and Sustainability, Uber
May 7, 2025


ZEV ドライバー
Globally, more than 230,000 ZEV drivers were active on Uber’s app in Q1 2025. That’s over 60% more than the same period a year earlier.
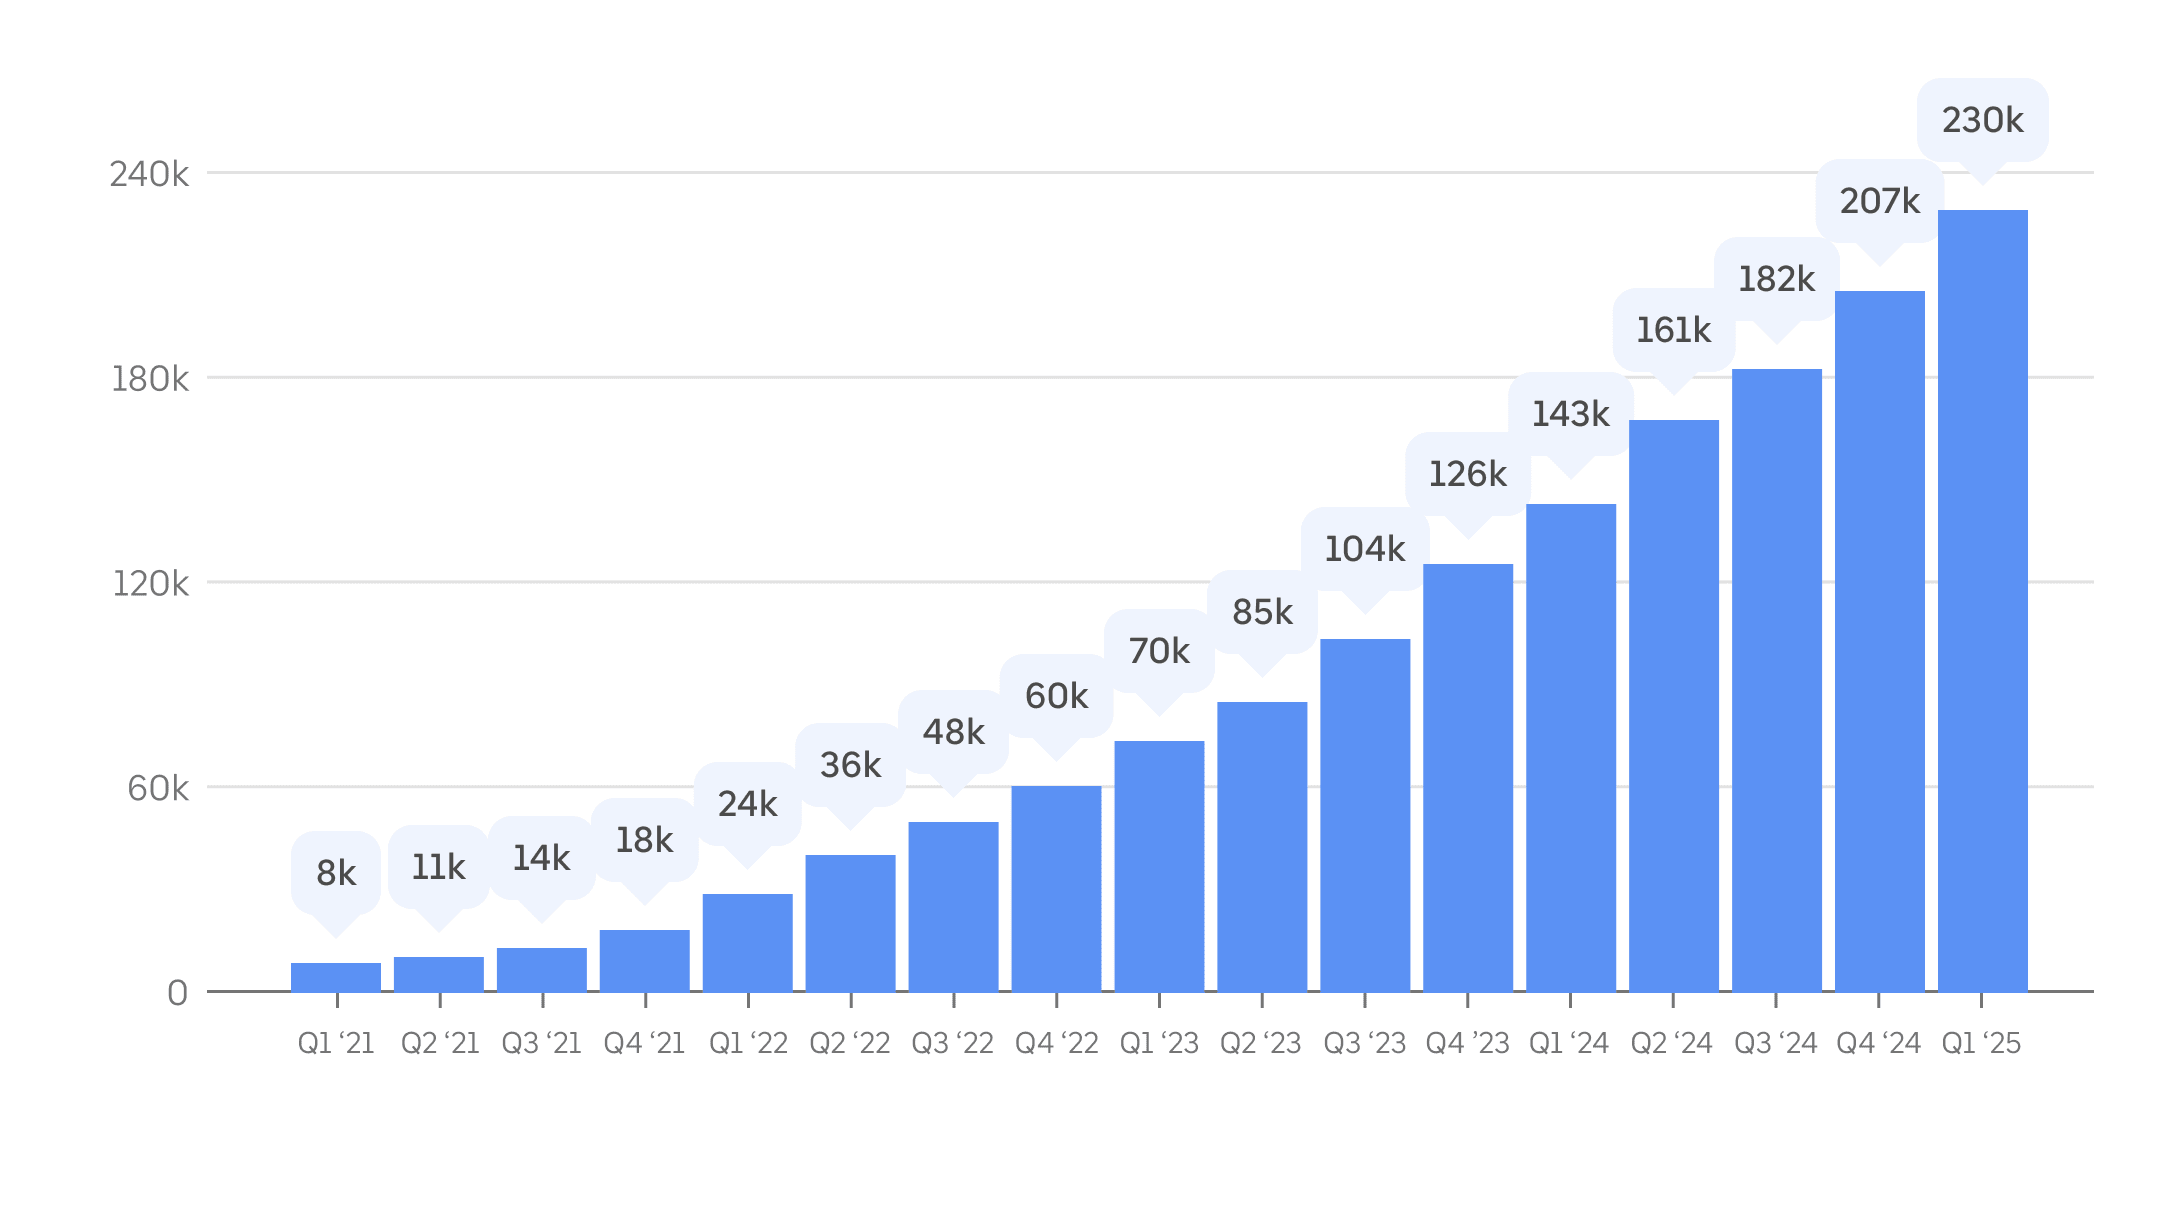
Metric: Average monthly active ZEV drivers on Uber, by quarter, since Q1 2021. Drivers using Uber’s app are counted as active in a given month if they’ve completed at least one trip in that calendar month.
ZEV の配車
In Q1 2025, ZEV drivers completed over 105 million tailpipe-emissions-free trips using Uber, globally—over 60% more than the number of ZEV trips completed on Uber during the same period a year earlier. That’s more than 13 ZEV trips on Uber every second, on average.
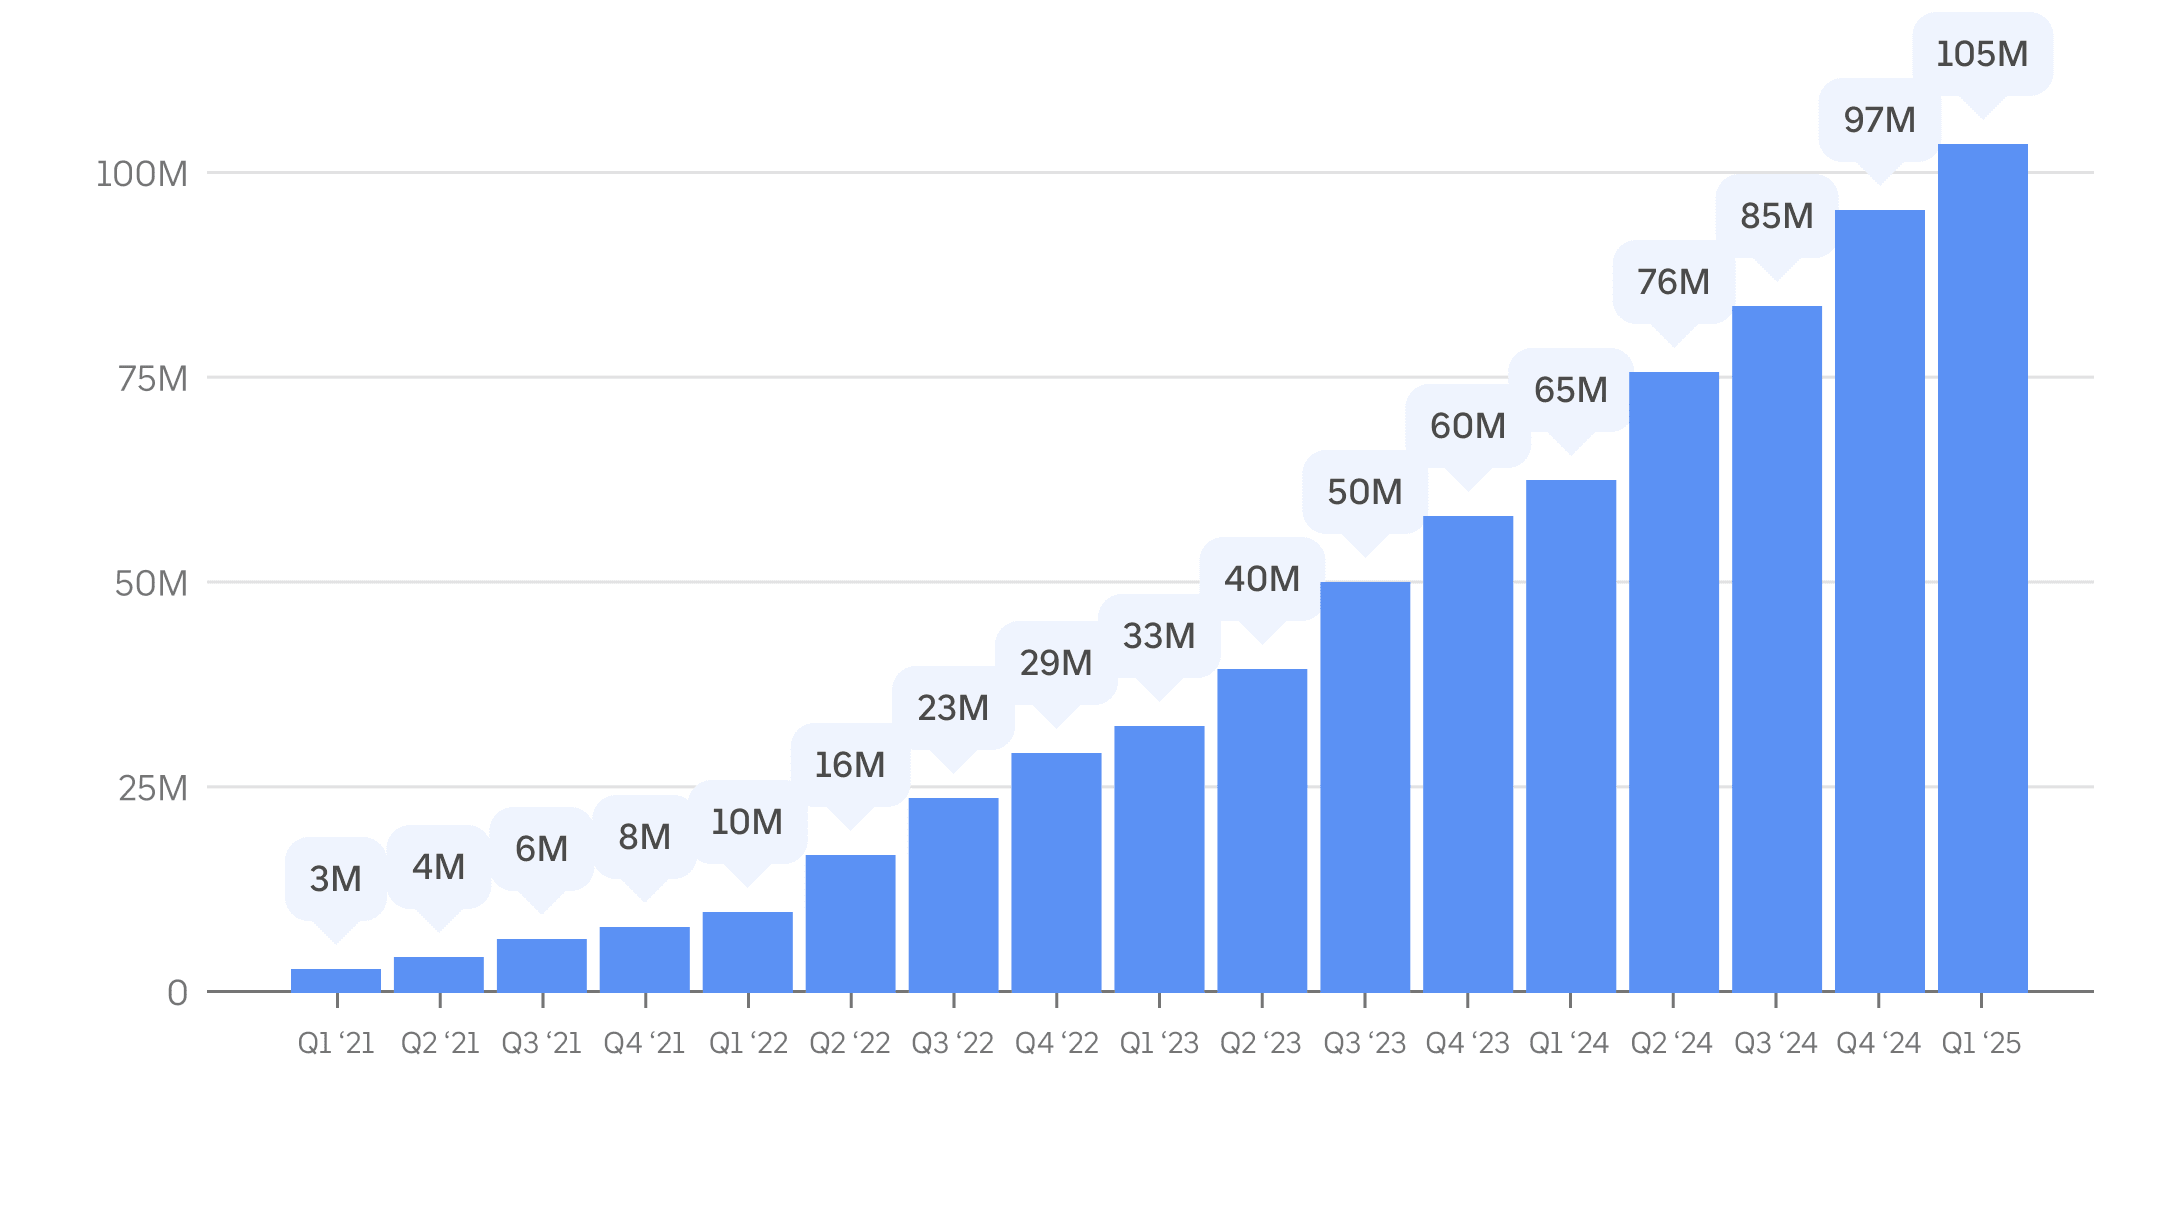
指標:Uber アプリで手配され、ZEV ドライバーによって実行された乗車サービスの回数(2021 年第 1 四半期以降、四半期ごとに集計)。
ZEV の普及率
In Q1 2025, ZEV drivers completed 15.3% of all on-trip miles in Europe and 9.1% of all on-trip miles in Canada and the US—adoption levels many times above drivers in the general public. Figures published in a 2024 BloombergNEF report show that ZEV uptake by Uber drivers in Europe was about 5 times faster than that of typical motorists.
Over the last 4 years, the average annual increase in all-electric on-trip mileage share on Uber in Europe and in the US and Canada was 3.1 and 2.2 percentage points, respectively. The highest and lowest annual increases recorded over that period occurred in the last year: since Q1 2024, ZEV uptake jumped more than 6 percentage points in Europe and just under 1 in the US and Canada.
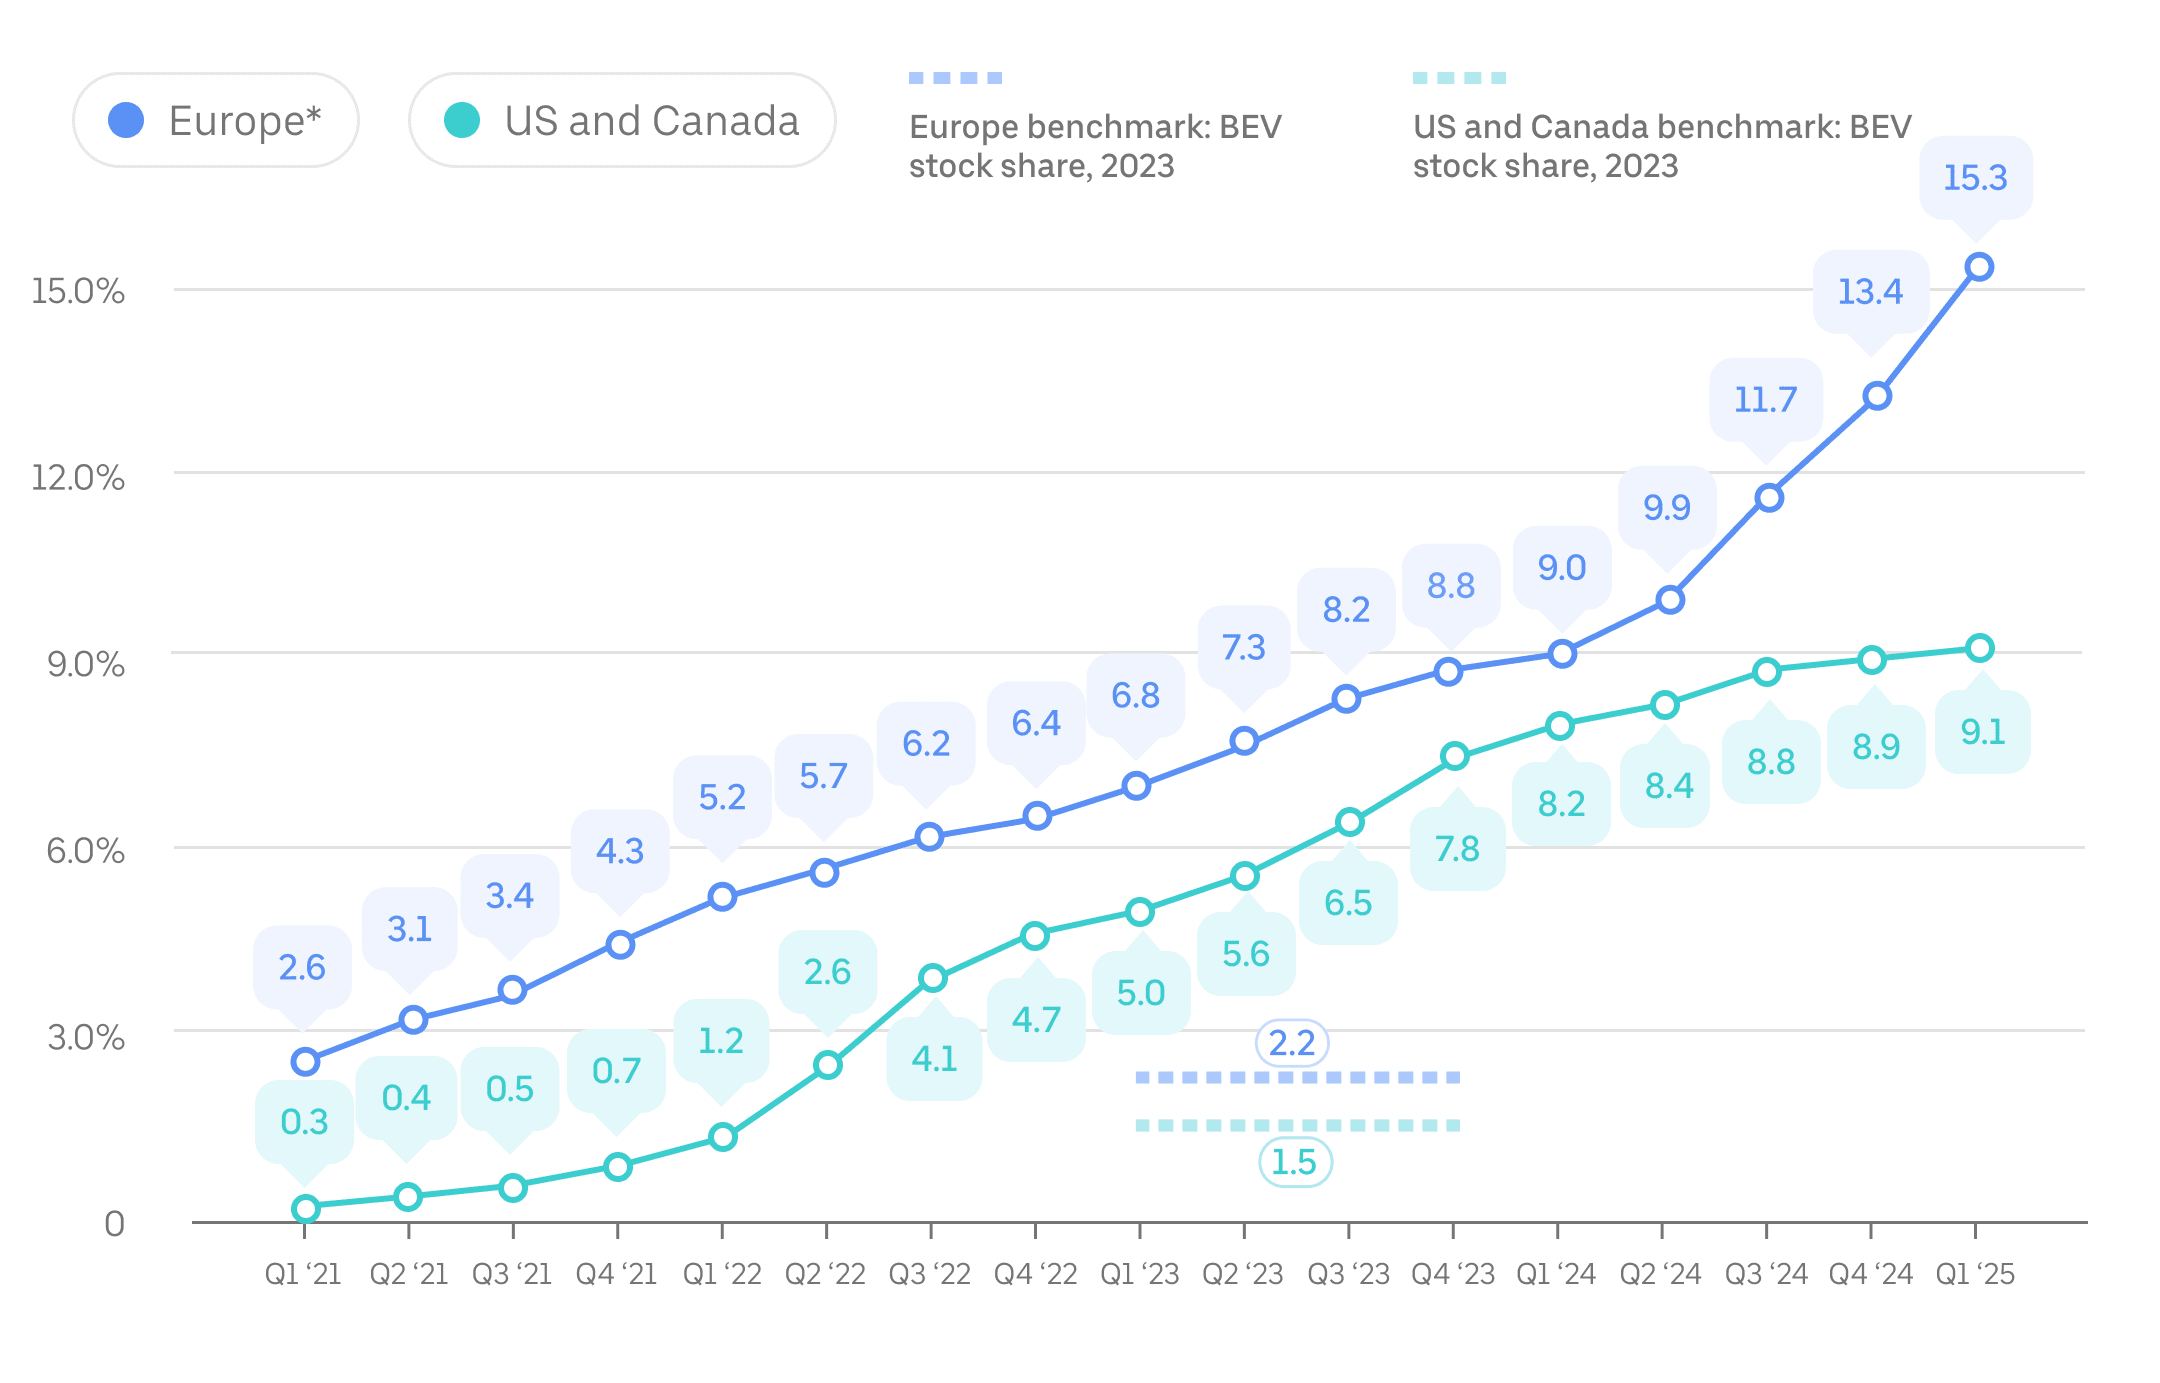
Metric: Share of on-trip miles completed in ZEVs compared with all on-trip miles arranged by the Uber app, by quarter since Q1 2021. Canada, US, and European benchmark data is as of 2023 (the most recently available at the time of this update) and is sourced from the International Energy Agency. “BEV” refers to battery electric vehicles.
乗客輸送の炭素集約度
In 2024, each mile that a passenger traveled on Uber resulted in an average generation of 197 grams of CO₂ in Europe (or 123 grams of CO₂ per kilometer) and 340 grams of CO₂ in the US and Canada (or 212 grams of CO₂ per kilometer). Compared with 2021, this passenger carbon intensity metric fell nearly 14% in Europe and 6% across the US and Canada.
Passenger carbon intensity in Europe, the US, and Canada increased slightly between 2023 and 2024 due to minor decreases in average passenger occupancy and increases in “deadheading” (vehicle mileage incurred before and on the way to picking up passengers).
Metric: Passenger carbon intensity, or the estimated grams of CO₂ per passenger mile traveled, is an annual efficiency metric used by Uber—and, increasingly, governments and companies around the world. In the case of ridesharing, or any on-demand mobility service, emissions produced by any deadhead miles are factored into the calculation.
For more details about how we calculate passenger carbon intensity, go to our methodology document. Note that significantly lower average fuel economy for vehicles on Uber in Europe versus the US and Canada explains most of the difference in carbon intensity in these 2 geographies. While the composition of vehicles that drivers use on Uber’s app in Europe is more efficient (with a higher proportion of ZEVs and hybrids), more-stringent fuel economy reporting standards in the US also contributes to this discrepancy. In addition, we lack access to sufficient input data to calculate passenger carbon intensity for trips completed in European markets before 2021.
よくある質問
- What is in Uber’s Electrification Update?
Our Electrification Update provides interested stakeholders with performance-based metrics on carbon-related emissions and electrification for passenger vehicle trips enabled by the Uber app.
- Why are you publishing this update?
This update, based on real-world use of our mobility platform, helps provide greater transparency of our electrification impact and helps us improve our efforts to support efficiency on our platform.
- What are the key measurements you use in the Electrification Update?
指標には以下の要素が含まれています。
- 2040 年までに世界の Uber で 100% のゼロエミッションモビリティを実現するという目標の進捗を測定するための、Uber の登録ドライバーによる ZEV の利用状況(ZEV で完了した乗車の走行距離の割合)。
- 乗客輸送の配車での走行距離 1 マイルあたりの排出量を測定する乗客輸送の炭素集約度
- How will this update improve emissions reduction and electrification uptake for rides on Uber?
We have bold ambitions to reduce the passenger carbon intensity of trips and increase the use of zero-emission vehicles on Uber. Measurement and transparency of the progress are important steps along our journey.
- 乗客は公共交通機関のような二酸化炭素排出量がより少ない方法ではなく、Uber を利用するのですか?
Uber アプリでの乗車サービスは、移動手段を探している人々が利用できるさまざまな交通手段の 1 つです。移動の選択肢は、さまざまな地域の市場環境により大きく異なります。US National Household Travel Survey のデータを Uber が分析した結果、最も持続可能な交通手段(公共交通機関、徒歩、自転車)の世帯あたりの利用率が高いほど、ライドシェアやその他のオンデマンドソリューションの利用率も高いことが示されています。
- 世界中の国や地域で同じデータを測定しますか?
Many of the above metrics now cover all passenger trips completed with the Uber app globally. We’re aligned to regular reporting on carbon emissions and other impact areas resulting from trips on Uber.
- With what frequency do you expect to provide Uber’s Electrification Update?
We update metrics at least annually and may update some metrics more frequently. We’ll release emissions metrics (like passenger carbon intensity) annually, aggregated by calendar year.
- 「ゼロエミッション車」とはどういう意味ですか?
Uber では、「ゼロエミッション車」(ZEV)という用語をカリフォルニア州大気資源委員会(CARB)や欧州交通環境連盟(T&E)と同意味で使用しています。具体的には、車載電源から直接 CO2 やその他の基準大気汚染物質(窒素酸化物、粒子状物質、CO2、硫黄酸化物など)を排出しない自動車を指します。用語の地域的な違いについては、読者の判断で適宜ご考慮ください。
Uber アプリを使用しているドライバーが現在運転している ZEV は、バッテリー式電気自動車(バッテリー式 EV)と、極まれに使用される水素を燃料とする燃料電池電気自動車(FCEV)の 2 種類です。
自明ですが、ZEV の「ゼロ」とは車の「排気管」からの排出がないことを意味し、車とそのエネルギー源の生産から廃棄に至るまでの排出をすべて考慮しているわけではありません。一方、すべてを計算に入れた場合、独立した専門家によるライフサイクル分析では、「現在登録されている中型バッテリー EV の平均的な耐用年数における排出量は、同等のガソリン車と比べて、ヨーロッパではすでに 66%~69%、米国では 60%~68%、中国では 37%~45%、インドでは 19%~34% 減少している」とされています。
- Will you measure impact for your Delivery business?
Our Electrification Update currently covers electrification and emissions metrics only for our Mobility business (ridesharing). We aim to include our progress on delivery emissions and electrification in future.
On packaging, Uber continues to invest in helping merchants transition to sustainable options. However, as with electrification, progress depends on collective action. We’re prioritizing efforts in cities where public and private investments are aligned. For example, in France over 60% of packaging used on the platform is recyclable, reusable, or compostable, supported by national policy and local incentives.
While progress has been made, based on current trends, we cannot meet all 2025 goals, and our 2030 goals will be out of reach without stronger, coordinated action across government and industry.
While many key levers are outside our control, we remain deeply committed to this transition. To learn more about Uber’s approach to more sustainable packaging with merchants, consult our Uber Eats for Merchants web page.
- Uber は、スコープ 1、2、3 の排出量を開示していますか?開示されている場合は、どこで確認できますか?
Uber discloses Scope 1, 2, and 3 emissions to CDP. You can find our most recent score in CDP’s public corporate score search. These emissions estimates have received limited assurance from an independent third party.
本ページおよび関連する気候評価および実績レポート、そして環境・社会・ガバナンスレポート(以下「レポート」)には、リスクと不確実性を伴う Uber の今後の事業における予想と目標に関連する将来の見通しについての記述が含まれています。実際の結果は、予想と大きく異なる場合があります。詳細については、レポートをご覧ください。
本レポートに開示されている特定のデータは、LRQA による限定的な保証を受けています。LRQA の検証報告書は、こちらからご覧ください。
Uber のカーボンオフセット使用の概要については、こちらをご覧ください。
本レポートで使用される「ドライバー」、「配達パートナー」、「売り上げ」、「ゼロエミッション車両」、「持続可能なパッケージ」などの用語は一般的なものであり、Uber Technologies, Inc. における一般的な使用例に従っています。用語の地域的な違いについては、読者の判断で適宜ご考慮ください。
Uber について