Uber’s Electrification Update
"Our ambitious efforts to transition to a zero-emission mobility platform have seen meaningful progress. Today, Uber is the world’s most widely available platform for zero-emission rides, with drivers adopting EVs up to 5 times faster than average motorists in the US, Canada, and Europe."
Rebecca Tinucci, Global Head of Electrification and Sustainability, Uber
Q1 2025 Update: This page includes metrics for trips completed on Uber by internal combustion engine (ICE) vehicles and zero-emission vehicles (ZEVs, such as battery EVs) from the beginning of the first quarter of 2021 to the end of the first quarter of 2025. Note that the scope of this report includes only Uber’s Mobility business (ridesharing).

Tracking our journey to zero emissions
Five years into our ambitious effort to transition to a zero-emission platform, we’ve made meaningful progress. Today, Uber is the world's most widely available platform for zero-emission rides, with drivers adopting EVs (electric vehicles) up to 5 times faster than average motorists in the US, Canada, and Europe.
We’ve invested hundreds of millions of dollars to help interested drivers make the switch to electric through incentives, partnerships, and product enhancements—and it’s paying off. Increasingly, riders are experiencing their first EV on Uber, helping to normalize and accelerate the adoption of electric transport all over the world.
Our data shows that EV progress quickens when government and industry work together to get the economics right. In cities like London, Vancouver, and Amsterdam, where thoughtful policies, industry investment, and strong charging networks align, more than 1 in every 3 miles on Uber are now electric.
Despite this significant progress, major barriers remain to fully achieve our goals. High upfront EV costs, limited charging access, and inconsistent policy support continue to slow adoption. Based on current trends, we cannot meet our remaining mobility and delivery goals for 2025, and our 2030 goals will be out of reach without stronger, coordinated action across government and industry.
As we’ve said from the start: climate is a team sport, and progress depends on collective action. That’s why we’re increasingly prioritizing efforts in cities where public and private investment are aligned.
While many key levers are outside our control, we remain deeply committed to this transition—not just because it’s the right thing to do, but also because it brings direct and strategic business benefits. Thousands of drivers around the world are taking home more money thanks to lower EV operating costs and rider demand for electric vehicles. Riders report higher satisfaction with the EV experience and are increasingly choosing EVs.
And finally, the future is shared, electric, and autonomous—and the coming wave of autonomous (electric) vehicles will create a major tailwind in achieving our sustainability goals.
Our latest update below outlines the progress to date, key insights, and areas of focus for 2025 and beyond.
__
Rebecca Tinucci, Global Head of Electrification and Sustainability, Uber
May 7, 2025


ZEV 合作车主
Globally, more than 230,000 ZEV drivers were active on Uber’s app in Q1 2025. That’s over 60% more than the same period a year earlier.
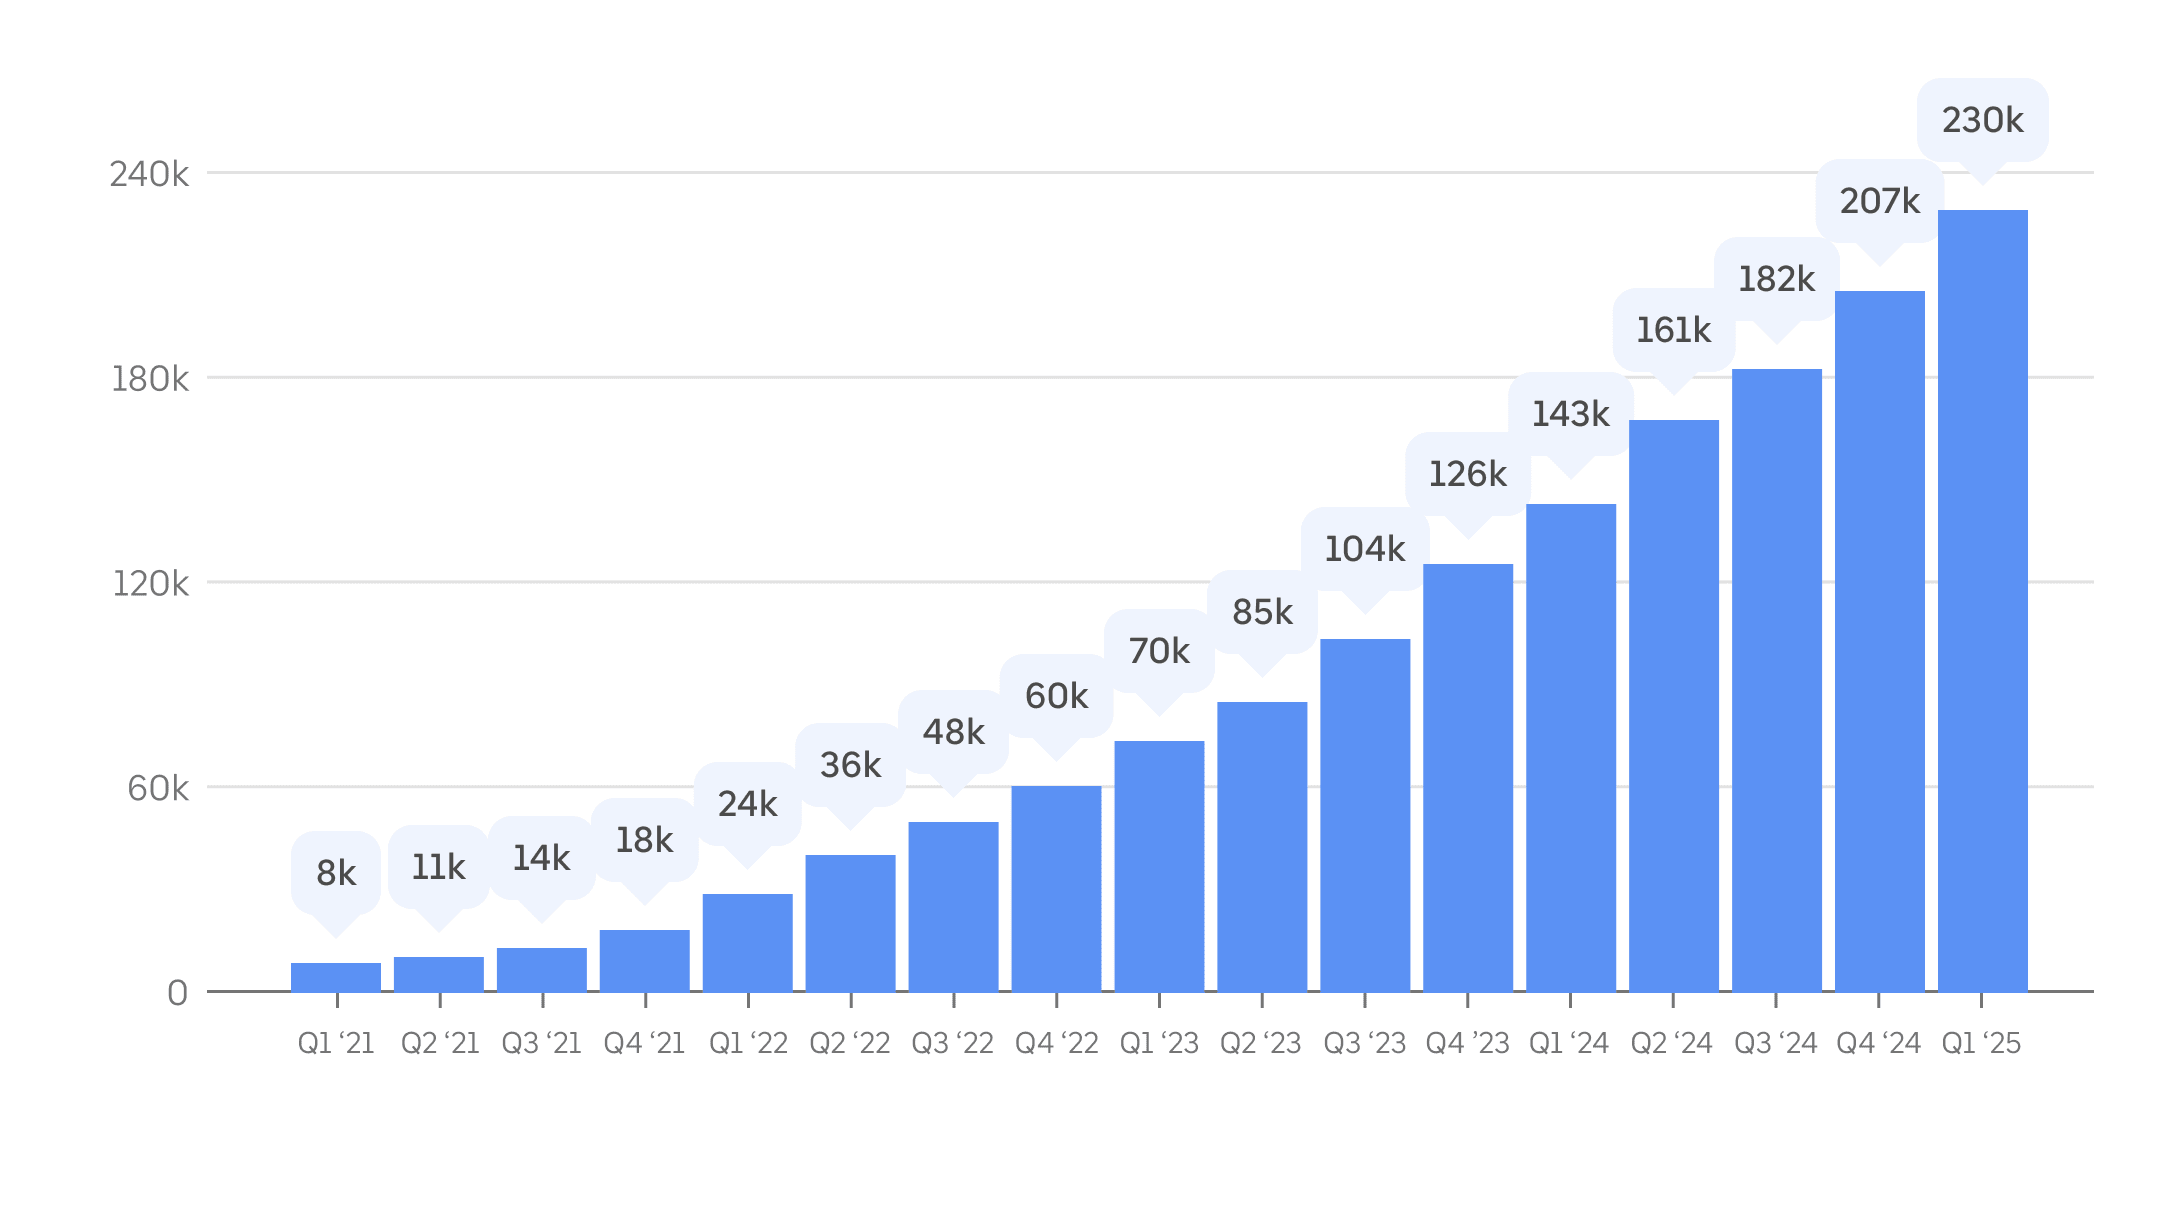
Metric: Average monthly active ZEV drivers on Uber, by quarter, since Q1 2021. Drivers using Uber’s app are counted as active in a given month if they’ve completed at least one trip in that calendar month.
ZEV 行程
In Q1 2025, ZEV drivers completed over 105 million tailpipe-emissions-free trips using Uber, globally—over 60% more than the number of ZEV trips completed on Uber during the same period a year earlier. That’s more than 13 ZEV trips on Uber every second, on average.
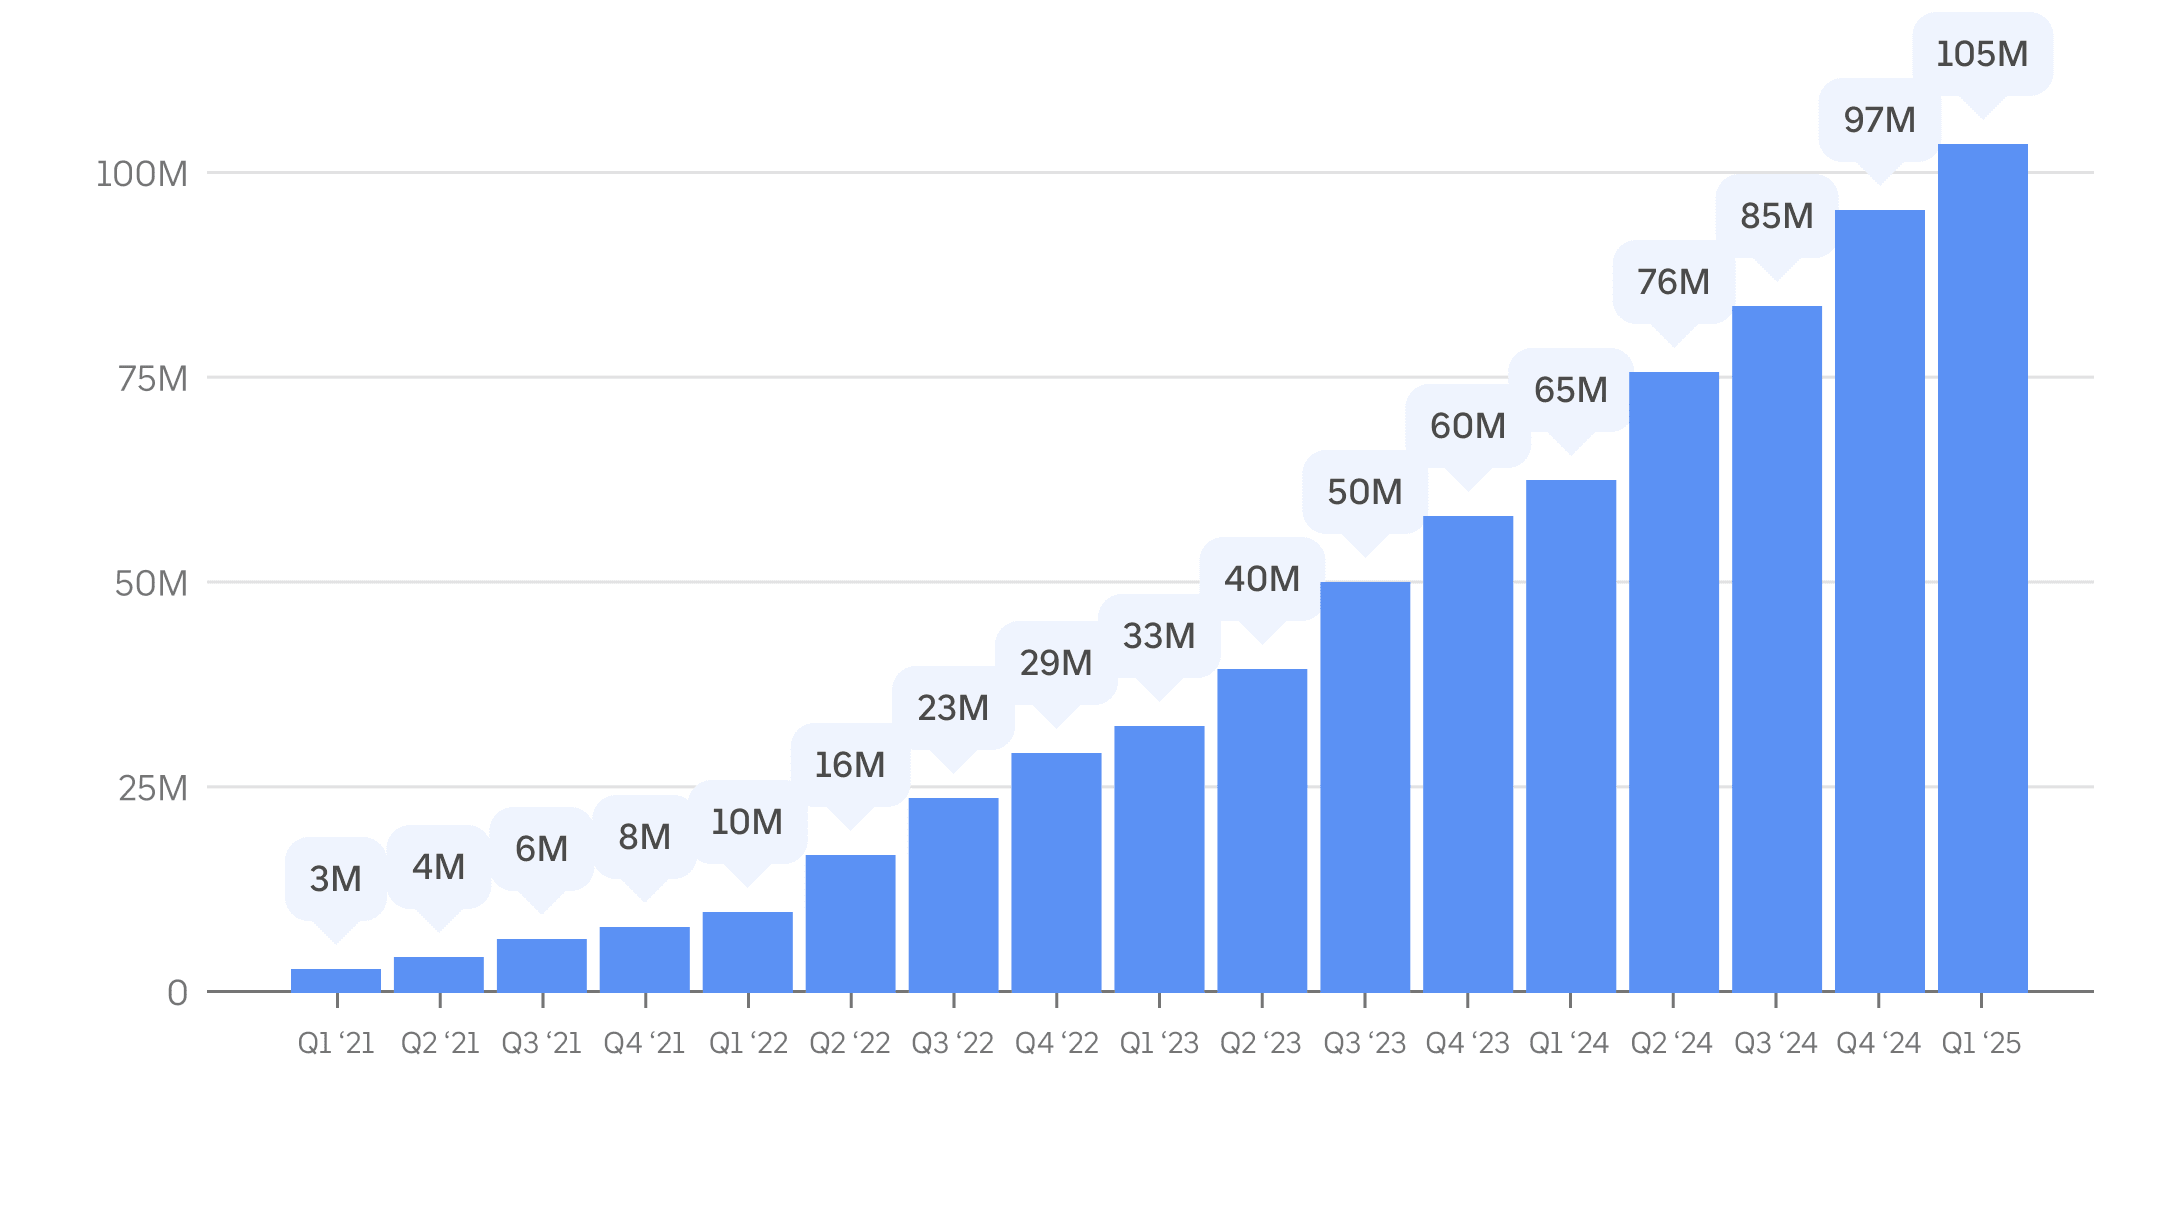
指标:2021 年第一季度以来每个季度,ZEV 合作车主通过优步应用完成的行程次数。
ZEV 使用情况
In Q1 2025, ZEV drivers completed 15.3% of all on-trip miles in Europe and 9.1% of all on-trip miles in Canada and the US—adoption levels many times above drivers in the general public. Figures published in a 2024 BloombergNEF report show that ZEV uptake by Uber drivers in Europe was about 5 times faster than that of typical motorists.
Over the last 4 years, the average annual increase in all-electric on-trip mileage share on Uber in Europe and in the US and Canada was 3.1 and 2.2 percentage points, respectively. The highest and lowest annual increases recorded over that period occurred in the last year: since Q1 2024, ZEV uptake jumped more than 6 percentage points in Europe and just under 1 in the US and Canada.
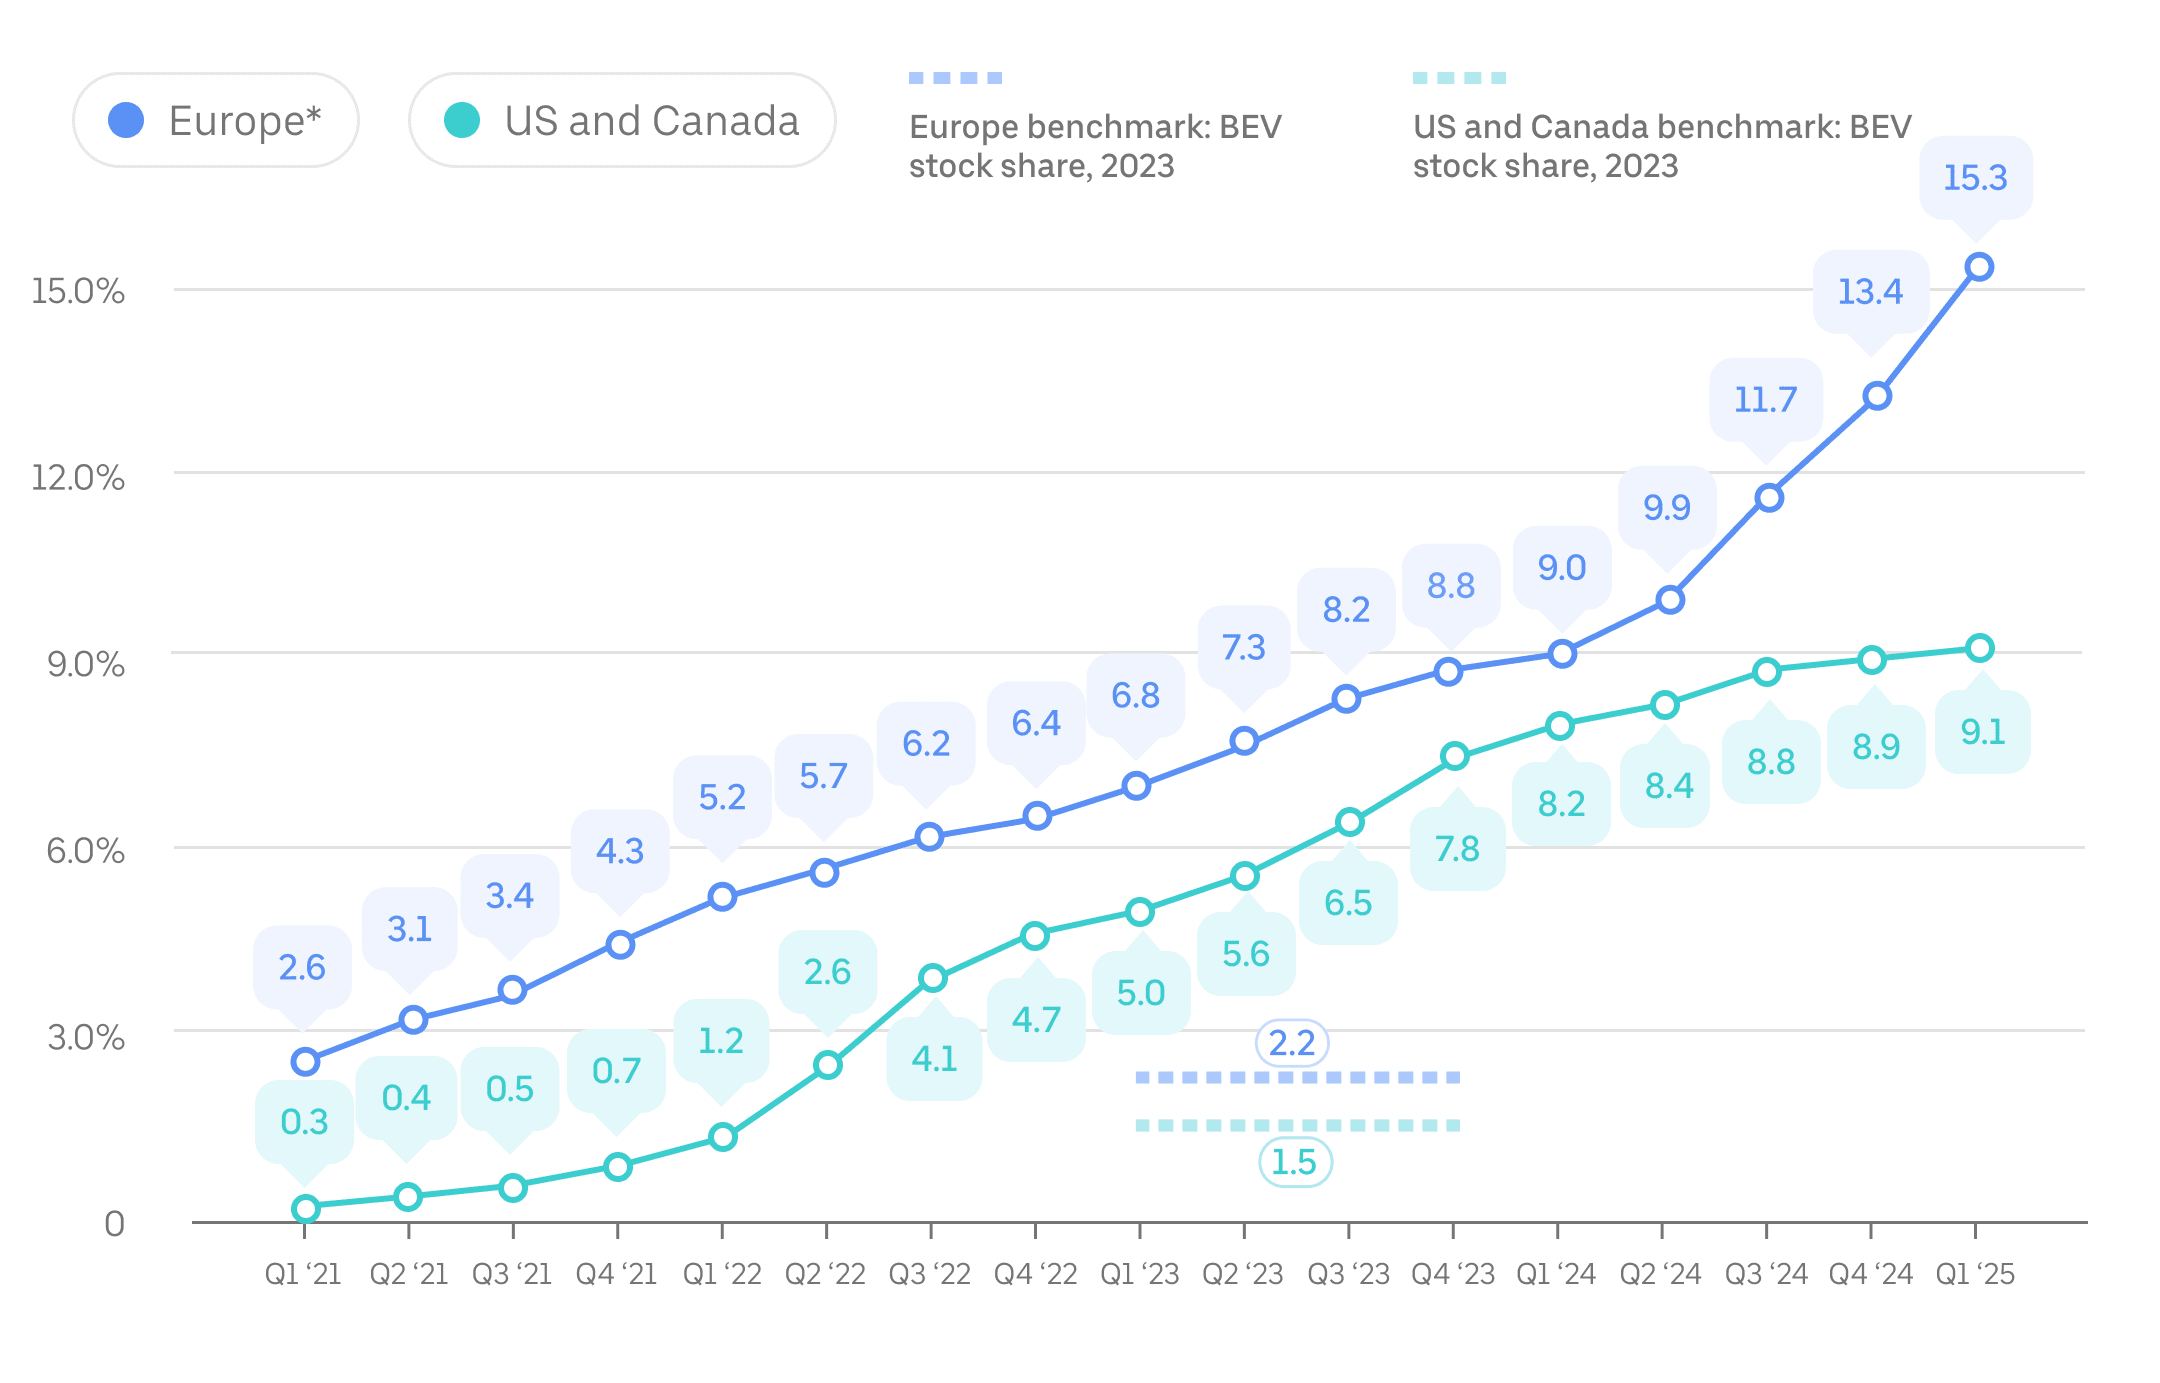
Metric: Share of on-trip miles completed in ZEVs compared with all on-trip miles arranged by the Uber app, by quarter since Q1 2021. Canada, US, and European benchmark data is as of 2023 (the most recently available at the time of this update) and is sourced from the International Energy Agency. “BEV” refers to battery electric vehicles.
乘客碳强度
In 2024, each mile that a passenger traveled on Uber resulted in an average generation of 197 grams of CO₂ in Europe (or 123 grams of CO₂ per kilometer) and 340 grams of CO₂ in the US and Canada (or 212 grams of CO₂ per kilometer). Compared with 2021, this passenger carbon intensity metric fell nearly 14% in Europe and 6% across the US and Canada.
Passenger carbon intensity in Europe, the US, and Canada increased slightly between 2023 and 2024 due to minor decreases in average passenger occupancy and increases in “deadheading” (vehicle mileage incurred before and on the way to picking up passengers).
Metric: Passenger carbon intensity, or the estimated grams of CO₂ per passenger mile traveled, is an annual efficiency metric used by Uber—and, increasingly, governments and companies around the world. In the case of ridesharing, or any on-demand mobility service, emissions produced by any deadhead miles are factored into the calculation.
For more details about how we calculate passenger carbon intensity, go to our methodology document. Note that significantly lower average fuel economy for vehicles on Uber in Europe versus the US and Canada explains most of the difference in carbon intensity in these 2 geographies. While the composition of vehicles that drivers use on Uber’s app in Europe is more efficient (with a higher proportion of ZEVs and hybrids), more-stringent fuel economy reporting standards in the US also contributes to this discrepancy. In addition, we lack access to sufficient input data to calculate passenger carbon intensity for trips completed in European markets before 2021.
常见问题
- What is in Uber’s Electrification Update?
Our Electrification Update provides interested stakeholders with performance-based metrics on carbon-related emissions and electrification for passenger vehicle trips enabled by the Uber app.
- Why are you publishing this update?
This update, based on real-world use of our mobility platform, helps provide greater transparency of our electrification impact and helps us improve our efforts to support efficiency on our platform.
- What are the key measurements you use in the Electrification Update?
指标包括:
- 优步合作车主的 ZEV 普及率(ZEV 完成的行程里程或公里数所占的份额),可以衡量优步到 2040 年成为零排放出行平台的这一全球目标的进展情况
- 乘客碳强度,用于衡量接载乘客时每英里所产生的排放量
- How will this update improve emissions reduction and electrification uptake for rides on Uber?
We have bold ambitions to reduce the passenger carbon intensity of trips and increase the use of zero-emission vehicles on Uber. Measurement and transparency of the progress are important steps along our journey.
- 乘客是否选择通过优步乘车,而非选择公共交通等低碳出行方式?
优步应用的出行服务是人们可以选择的众多交通方式之一。行程选项在很大程度上取决于当地各种市场条件。我们对美国全国家庭出行调查数据的分析表明,可持续交通方式(公共交通、步行和骑自行车)的每户利用率越高,共享出行和其他按需出行解决方案的利用率就越高。
- 针对全球其他国家或地区,优步是否会使用同样的数据?
Many of the above metrics now cover all passenger trips completed with the Uber app globally. We’re aligned to regular reporting on carbon emissions and other impact areas resulting from trips on Uber.
- With what frequency do you expect to provide Uber’s Electrification Update?
We update metrics at least annually and may update some metrics more frequently. We’ll release emissions metrics (like passenger carbon intensity) annually, aggregated by calendar year.
- “零排放车辆”是什么意思?
我们使用“零排放车辆” (ZEV) 一词的方式与加州空气资源委员会 (CARB) 和欧洲交通与环境组织 (T&E) 的方式相同,即车载电源不会直接产生二氧化碳排放或其他标准空气污染物(例如氮氧化物、颗粒物、二氧化碳和硫氧化物)的车辆。词语的区域差异由读者自行判别。
目前,优步应用的合作车主使用 2 种类型的零排放车辆:纯电动汽车,以及(极少数情况下)氢燃料电池电动车 (FCEV)。
当然,零排放车辆的“零”是指车辆“排气管”没有排放,并不一定将车辆及其能源从生产到处置的所有排放量都计算在内。即使全部计算在内,独立专家进行的生命周期分析表明,“目前在册的中型纯电动汽车在其生命周期内的平均排放量均低于同类汽油车辆:66%–69%(欧洲)、60%–68%(美国)、37%–45%(中国)、19%–34%(印度)”。
- Will you measure impact for your Delivery business?
Our Electrification Update currently covers electrification and emissions metrics only for our Mobility business (ridesharing). We aim to include our progress on delivery emissions and electrification in future.
On packaging, Uber continues to invest in helping merchants transition to sustainable options. However, as with electrification, progress depends on collective action. We’re prioritizing efforts in cities where public and private investments are aligned. For example, in France over 60% of packaging used on the platform is recyclable, reusable, or compostable, supported by national policy and local incentives.
While progress has been made, based on current trends, we cannot meet all 2025 goals, and our 2030 goals will be out of reach without stronger, coordinated action across government and industry.
While many key levers are outside our control, we remain deeply committed to this transition. To learn more about Uber’s approach to more sustainable packaging with merchants, consult our Uber Eats for Merchants web page.
- 优步是否披露范围 1、范围 2 和范围 3 排放量?如果是,在哪里可以找到相关数据?
Uber discloses Scope 1, 2, and 3 emissions to CDP. You can find our most recent score in CDP’s public corporate score search. These emissions estimates have received limited assurance from an independent third party.