Uber’s Climate Assessment and Performance Report
The environmental impact of trips served by Uber’s platform matters. It’s our responsibility to measure that impact by evaluating data gathered from the real-world use of Uber, share the results publicly for greater transparency, and act to improve our climate performance.
April 2024 update: This page reflects metrics for trips completed by zero-emission vehicles (ZEVs) from the beginning of the first quarter of 2021 to the end of the first quarter of 2024. Note that this report includes information related only to Uber’s Mobility business (ridesharing).
“The road to zero emissions requires transparency and being accountable for progress year after year. Uber is proud to be the first mobility platform to measure and report on emissions from customers’ real-world use of our products.”
Dara Khosrowshahi, CEO, Uber
ZEV drivers
Globally, about 143,000 ZEV drivers a month, on average, actively used Uber’s app in Q1 2024. That’s more than double the same period a year earlier.
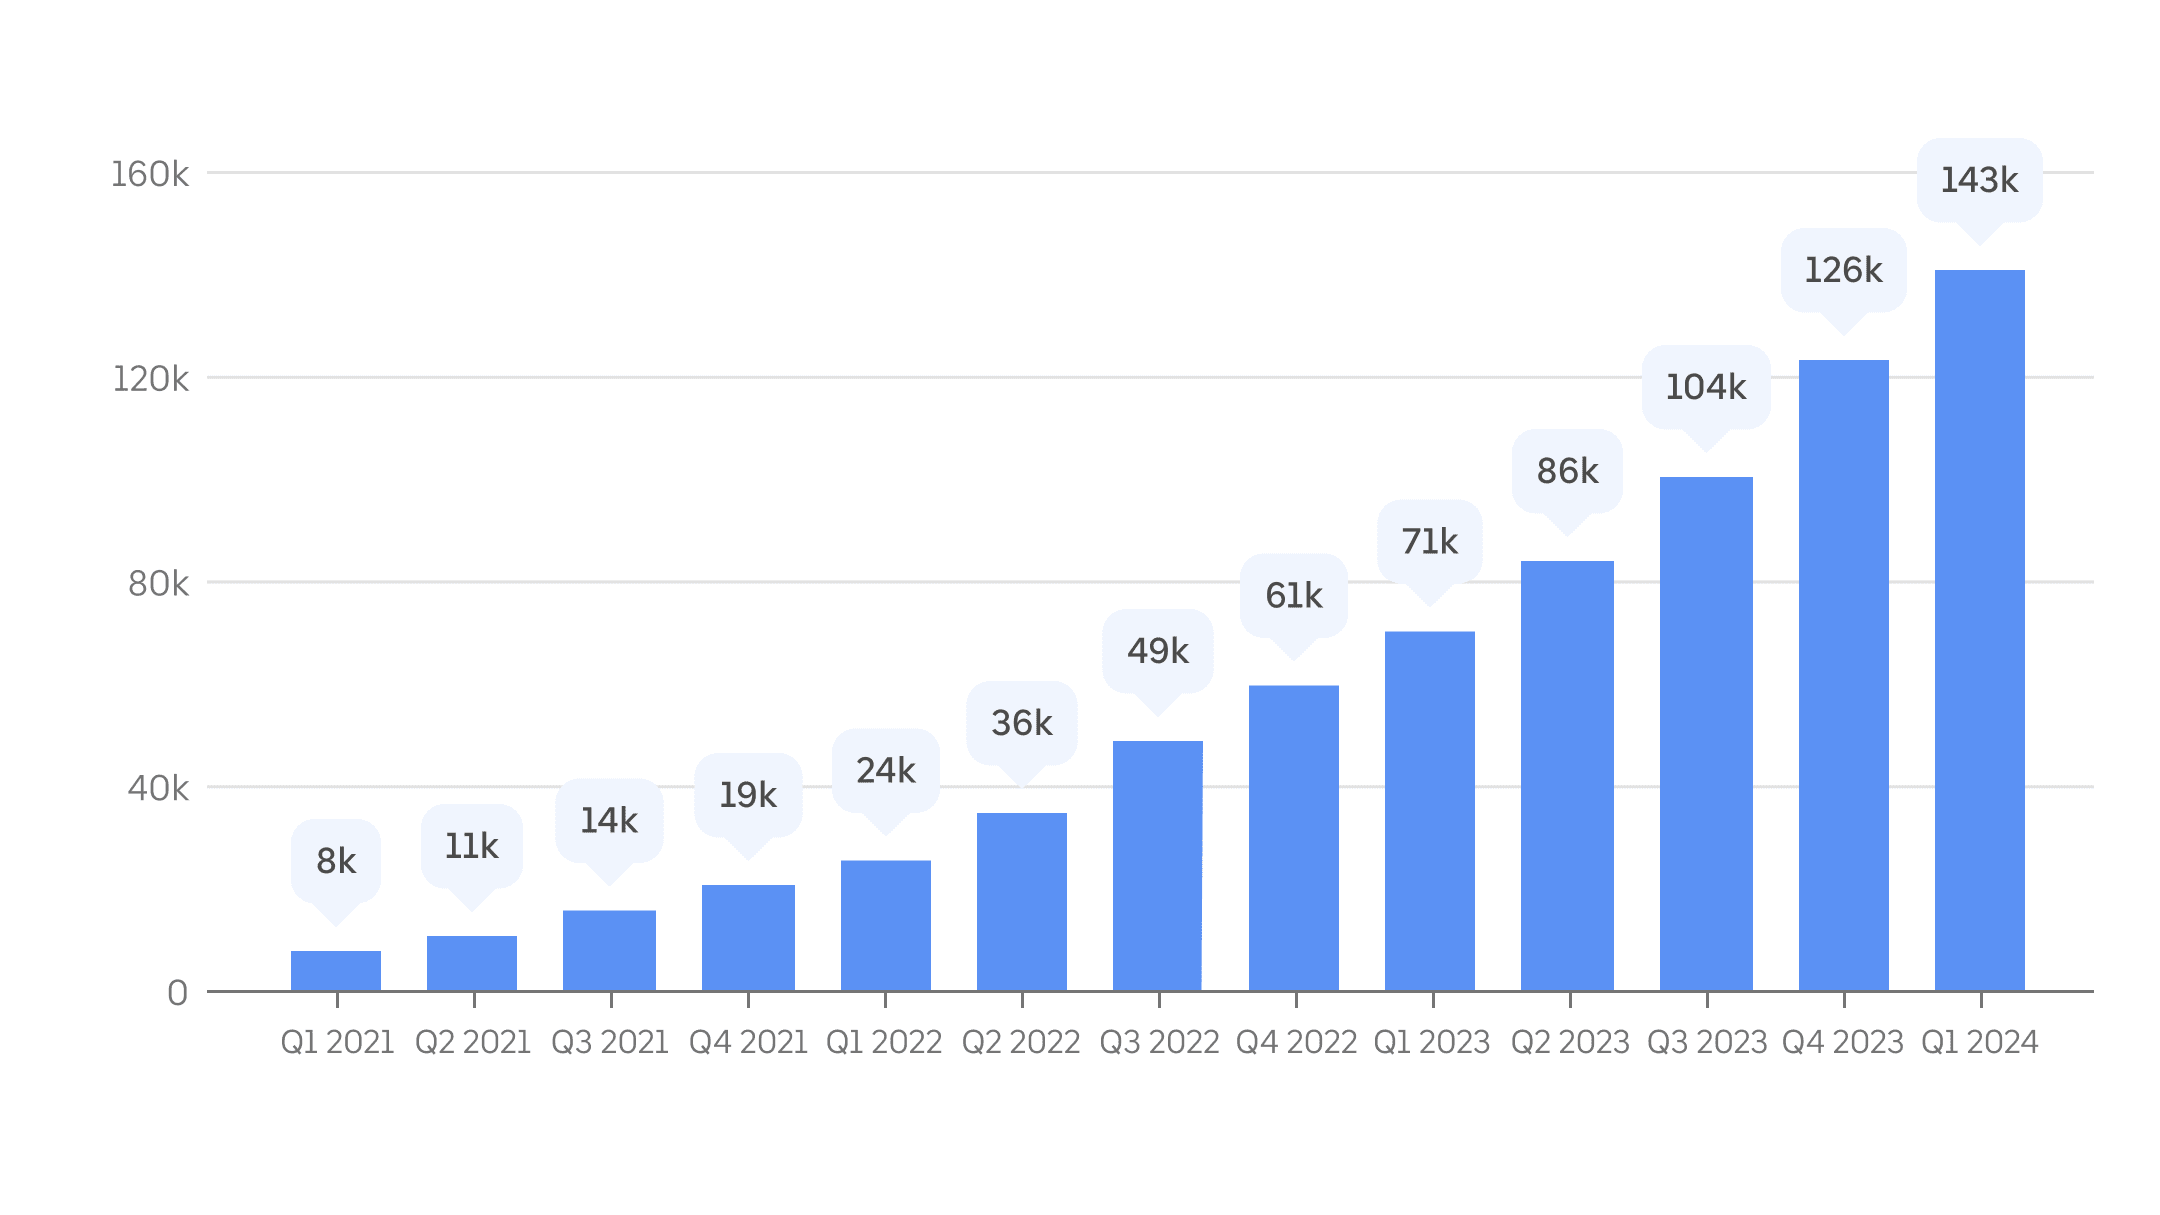
Metric: Average monthly active ZEV drivers on Uber, by quarter, since Q1 2021, the start of the first full calendar year after announcing our sustainability goals. Drivers using Uber’s app are counted as active in a given month if they’ve completed at least one trip in that calendar month.
Note: as of Q1 2024, we’ve updated this metric to cover all markets where Uber’s mobility app operates; previous versions of our reporting covered only trips in Canada, the US, and 7 countries in Europe.
ZEV trips
In Q1 2024, ZEV drivers provided nearly 66 million tailpipe-emissions-free trips using Uber, globally. This is nearly twice times the number of ZEV trips completed on Uber during the same period a year earlier.
Metric: Number of trips arranged on the Uber app and fulfilled by ZEV drivers, by quarter since Q1 2021.
Note: The same methodology changes to geographic scope noted above were applied to this metric.
ZEV uptake
In Q1 2024, ZEV drivers completed 9.0% of all on-trip miles in Europe and 8.2% of all on-trip miles in Canada and the US. That represents increases of 2.2 and 3.2 percentage points, respectively, compared with the same period a year earlier. These results correspond with figures published in a recent BloombergNEF report that show ZEV uptake by Uber drivers in Europe is happening about 5 times faster than that of drivers in the general public.
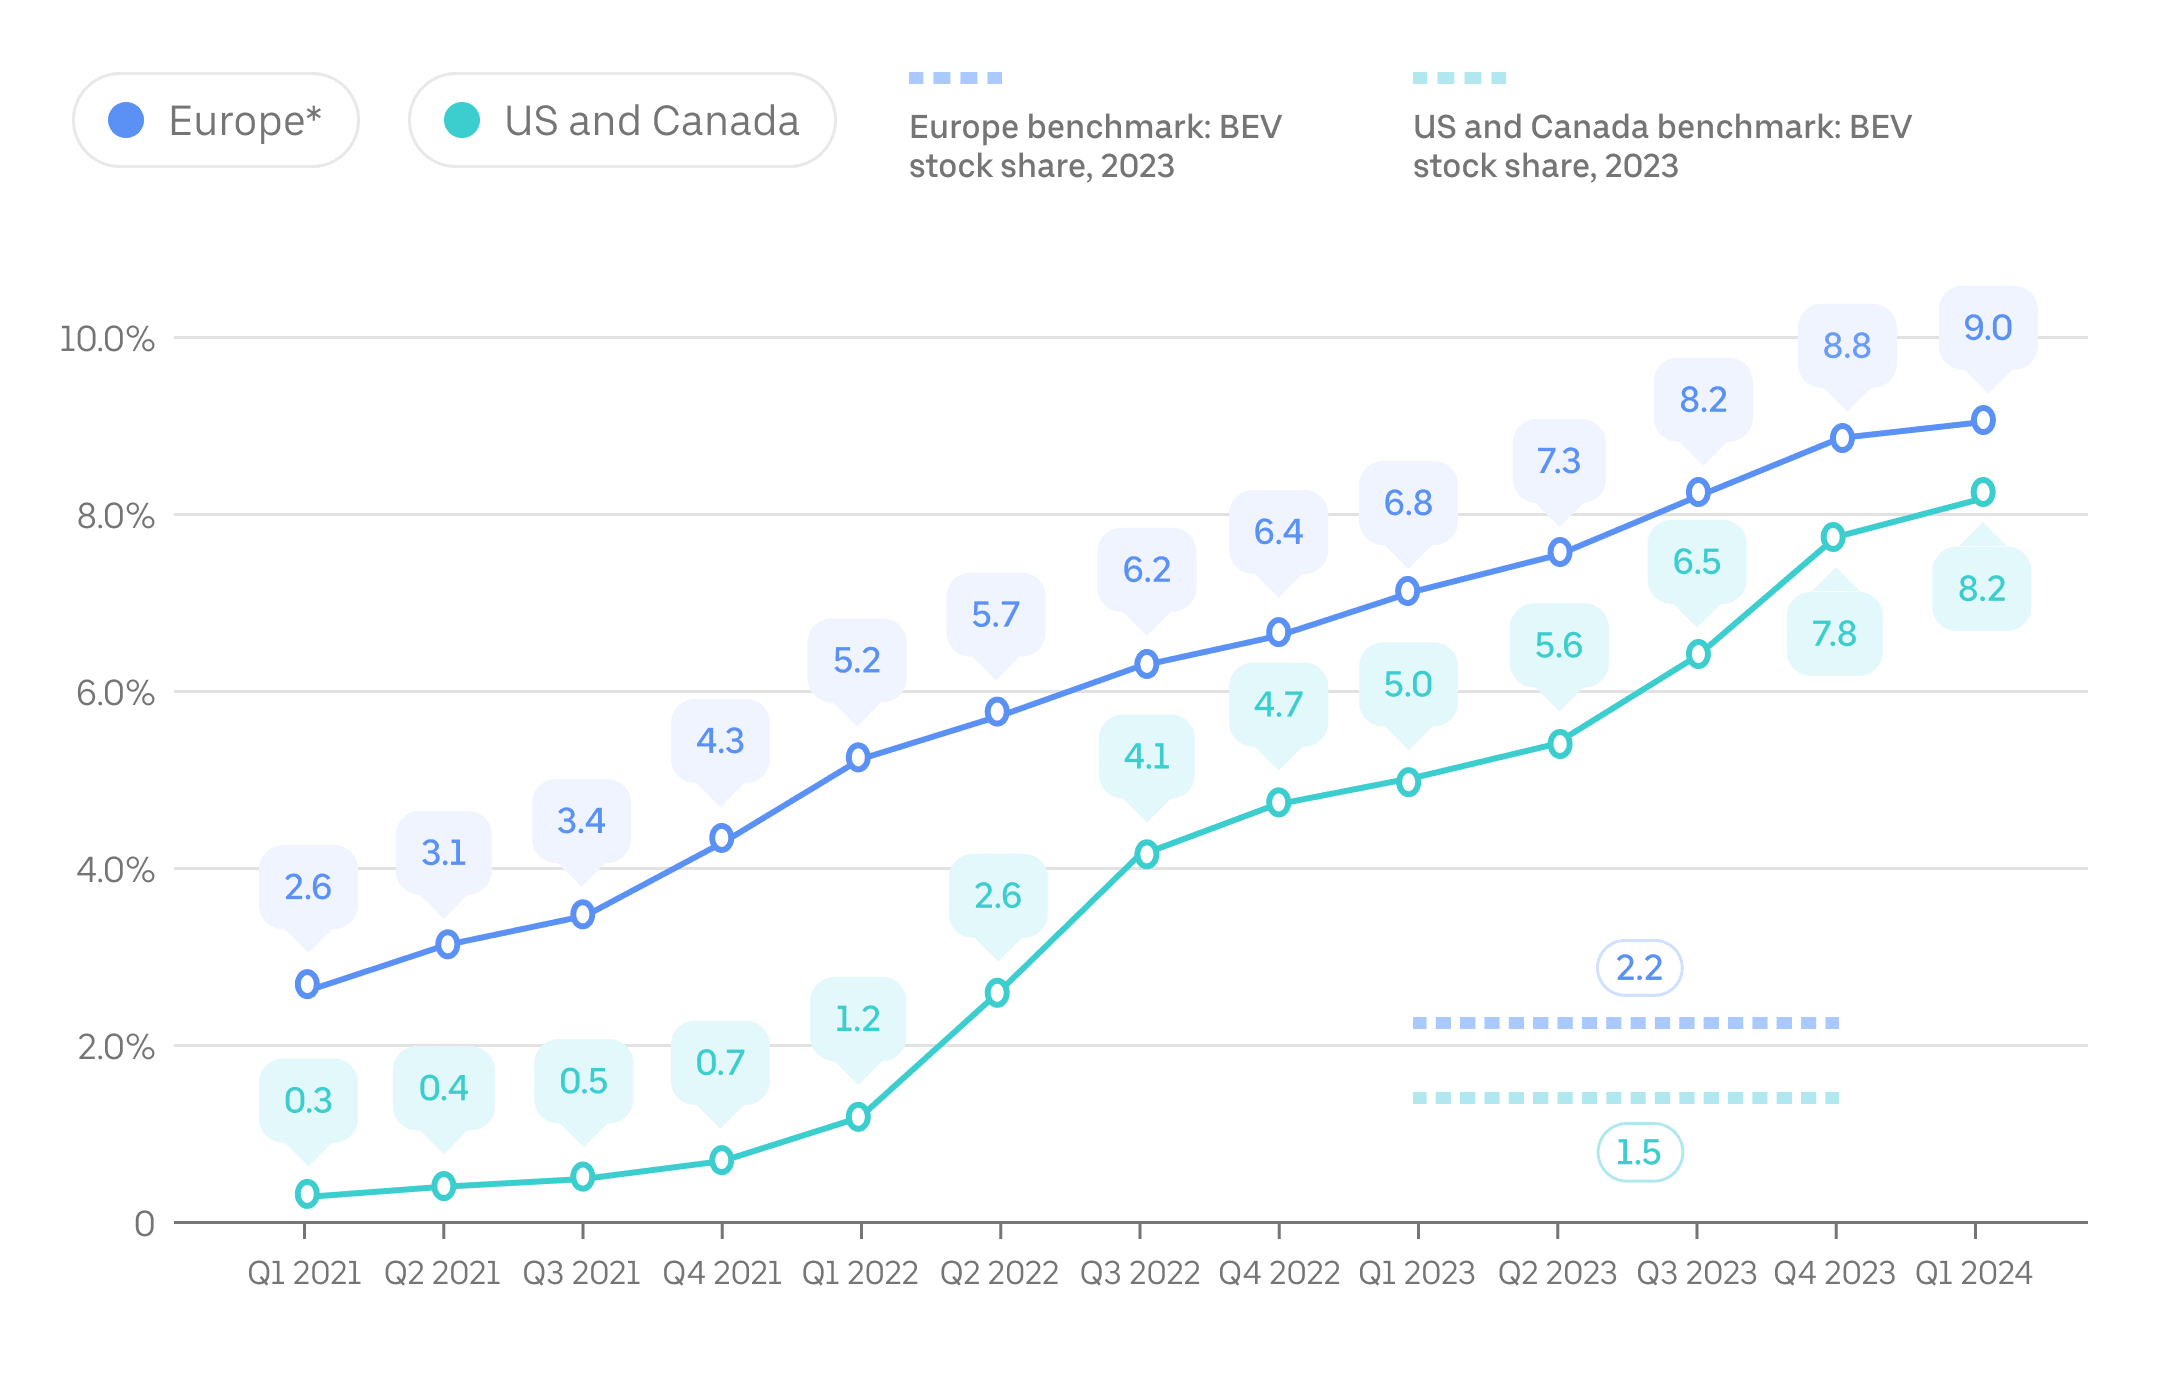
Metric: Share of on-trip miles completed in ZEVs compared with all on-trip miles arranged by the Uber app, by quarter since Q1 2021. Canada, US, and European benchmark data is as of 2023 and is sourced from the International Energy Agency. “BEV” refers to battery electric vehicles.
Note: as of Q1 2024, we’ve updated the ZEV uptake metric for Europe to cover all markets where the Uber mobility app is used in Europe.
Passenger carbon intensity
In 2023, each mile that a passenger traveled on Uber resulted in an average generation of 191 grams of CO2 in Europe (or 119 grams of CO2 per kilometer) and 307 grams of CO2 in the US and Canada (or 192 grams of CO2 per kilometer). Compared with 2021, this passenger carbon intensity metric fell 20% in Europe and 15% across the US and Canada.
Metric: Passenger carbon intensity, or the estimated grams of CO2 per passenger mile traveled, is a climate and efficiency metric used by Uber—and, increasingly, governments and companies around the world. In the case of ridesharing, or any on-demand mobility service, emissions produced by any “deadhead” miles—vehicle miles traveled without a passenger—are factored into the calculation.
For more details about how we calculate carbon intensity, go to our methodology document. Note that significantly lower average fuel economy for vehicles on Uber in Europe versus the US and Canada explain most of the difference in carbon intensity in these 2 geographies. While the composition of vehicles that drivers use on Uber’s app in Europe is more efficient, with a higher proportion of ZEVs and hybrids, more-stringent fuel economy reporting standards in the US also contribute to this discrepancy. In addition, we lack access to sufficient input data to calculate passenger carbon intensity for trips completed in European markets before 2021.
Note: as of Q1 2024, we’ve updated the passenger carbon intensity metric for Europe to cover all markets where the Uber mobility app is used on the European continent; previous versions of our reporting covered only 7 European countries.
Insights and deep dives
Driving the next phase of electric mobility in Europe (2024)
Saving emissions with sustainable routing (2023)
How Uber helps drivers go electric (2022)
Equitable electrification: early findings from the Uber-Hertz partnership (2022)
Why Uber is fundamentally different from the private car (2021)
Measuring mobility for carbon intensity (2019)
Sharing the road—travel efficiency (2019)
Frequently asked questions
- What is in Uber’s latest Climate Assessment and Performance Report?
Our Climate Assessment and Performance Report provides city officials, environmental advocates, users, and other stakeholders with performance-based metrics on emissions and electrification for passenger vehicle trips enabled by the Uber app.
- Why are you publishing this report?
The environmental impact of trips completed with Uber’s app matters. It’s our responsibility to report transparently on performance and take action to improve it. Our analysis shows that emissions resulting from the use of our platform are the most material component of Uber’s carbon footprint. This report, based on real-world use of our platform, helps provide greater transparency on our climate impact and helps us improve our efforts to support drivers’ fair transition to ZEVs and reduce emissions resulting from rides.
You can read our first report (2020) here and our second report (2021) here. Since our 2021 report, we have only published updates on this webpage.
- What are the key measurements you use in the Climate Assessment and Performance Report?
Metrics include the following:
- ZEV uptake by drivers on Uber (share of on-trip miles or kilometers completed in ZEVs), which measures our progress toward our goal of 100% zero-emission mobility on Uber globally by 2040
- Passenger carbon intensity, which measures the emissions resulting from every passenger mile
- How will this report improve emissions reduction and electrification uptake for rides on Uber?
We have bold ambitions to reduce the passenger carbon intensity of trips and increase the use of zero-emission vehicles on Uber. Measuring what you manage and being transparent on our progress are important steps along our journey.
- Do riders take trips with Uber instead of using lower-carbon options like public transit?
Rides with the Uber app are one of many transportation options available to people who are looking for a ride. Trip choice depends a lot on various local market conditions. Our analysis of US National Household Travel Survey data shows that a higher per-household utilization of the most sustainable transportation modes (transit, walking, and biking) correlates with a higher utilization of ridesharing and other on-demand solutions.
- Will you measure the same data for other countries or regions around the world?
Our first report, published in 2020, covered the US and Canada. We added major European markets to our second report, published in 2021. Many of the above metrics now cover all passenger trips completed with the Uber app globally. We’re aligned to regular reporting on climate emissions and other impact areas resulting from trips on Uber. We aim to expand the geographic scope of markets covered in the report over time for all our reporting metrics, including ZEV uptake and passenger carbon intensity.
- How often do you update these metrics and the report?
We update all metrics at least annually and may update some metrics more frequently. We will release emissions metrics (like passenger carbon intensity) annually, aggregated by calendar year.
- What do you mean by “zero-emission vehicle”?
We use the term “zero-emission vehicle” (ZEV) the same way the California Air Resources Board (CARB) and Europe’s Transport & Environment (T&E) do: to refer to vehicles that produce no direct CO2 emissions or other criteria air pollutants (such as NOx, particulate matter, CO₂, and SOx) from the on-board source of power. Regional variations should be considered at the reader’s discretion.
Drivers using Uber’s app use 2 types of ZEVs today: battery electric vehicles (battery EVs) and, very occasionally, hydrogen-powered fuel cell electric vehicles (FCEVs).
Of course, the “zero” in ZEV refers to no emissions from the proverbial “tailpipe” of the vehicle and not necessarily all the emissions that can be accounted for from production to disposal of the vehicle and its energy source. All accounted for, however, life-cycle analyses by independent experts show that “emissions over the lifetime of average medium-size battery EVs registered today are already lower than comparable gasoline cars by 66%–69% in Europe, 60%–68% in the United States, 37%–45% in China, and 19%–34% in India.”
- Will you measure impact for your Uber Eats, delivery, and Uber Freight businesses, which now make up a large share of Uber’s business?
Our Climate Assessment and Performance Report currently covers electrification and emissions metrics only for our Mobility business (ridesharing). We aim to include our Delivery and Freight businesses in this environmental sustainability report in the future.
To understand the steps we are taking across Delivery as well as Uber Freight, please consult Uber’s 2024 Environmental, Social, and Governance Report.
- Does Uber disclose Scope 1, 2, and 3 emissions, and, if so, where would they be found?
In Uber’s Environmental, Social, and Governance Report, you can find Uber’s emissions breakdown across Scope 1, 2, and 3 emissions, all of which have received limited assurance from an independent third party.
This page and the related Climate Assessment and Performance Reports and Environmental, Social, and Governance Reports (“the report”) contain forward-looking statements regarding our future business expectations and goals, which involve risks and uncertainties. Actual results may differ materially from the results anticipated. For more information, please go to our reports.
Europe refers to European markets where Uber operated as of Q1 2024.
Climate data disclosed in this report has received limited assurance from LRQA. LRQA’s verification statement can be found here.
The use of terms in this report such as “drivers”, “couriers”, “earn”, “zero- emission vehicle”, and “sustainable packaging” are general, and follow the general use-case of the word by Uber Technologies, Inc. Regional variations of words should be considered at the reader’s discretion.
About
Explore
Car service cities
Jobs by city
Popular routes