Uber’s Electrification Update
"Our ambitious efforts to transition to a zero-emission mobility platform have seen meaningful progress. Today, Uber is the world’s most widely available platform for zero-emission rides, with drivers adopting EVs up to 5 times faster than average motorists in the US, Canada, and Europe."
Rebecca Tinucci, Global Head of Electrification and Sustainability, Uber
Q1 2025 Update: This page includes metrics for trips completed on Uber by internal combustion engine (ICE) vehicles and zero-emission vehicles (ZEVs, such as battery EVs) from the beginning of the first quarter of 2021 to the end of the first quarter of 2025. Note that the scope of this report includes only Uber’s Mobility business (ridesharing).

Tracking our journey to zero emissions
Five years into our ambitious effort to transition to a zero-emission platform, we’ve made meaningful progress. Today, Uber is the world's most widely available platform for zero-emission rides, with drivers adopting EVs (electric vehicles) up to 5 times faster than average motorists in the US, Canada, and Europe.
We’ve invested hundreds of millions of dollars to help interested drivers make the switch to electric through incentives, partnerships, and product enhancements—and it’s paying off. Increasingly, riders are experiencing their first EV on Uber, helping to normalize and accelerate the adoption of electric transport all over the world.
Our data shows that EV progress quickens when government and industry work together to get the economics right. In cities like London, Vancouver, and Amsterdam, where thoughtful policies, industry investment, and strong charging networks align, more than 1 in every 3 miles on Uber are now electric.
Despite this significant progress, major barriers remain to fully achieve our goals. High upfront EV costs, limited charging access, and inconsistent policy support continue to slow adoption. Based on current trends, we cannot meet our remaining mobility and delivery goals for 2025, and our 2030 goals will be out of reach without stronger, coordinated action across government and industry.
As we’ve said from the start: climate is a team sport, and progress depends on collective action. That’s why we’re increasingly prioritizing efforts in cities where public and private investment are aligned.
While many key levers are outside our control, we remain deeply committed to this transition—not just because it’s the right thing to do, but also because it brings direct and strategic business benefits. Thousands of drivers around the world are taking home more money thanks to lower EV operating costs and rider demand for electric vehicles. Riders report higher satisfaction with the EV experience and are increasingly choosing EVs.
And finally, the future is shared, electric, and autonomous—and the coming wave of autonomous (electric) vehicles will create a major tailwind in achieving our sustainability goals.
Our latest update below outlines the progress to date, key insights, and areas of focus for 2025 and beyond.
__
Rebecca Tinucci, Global Head of Electrification and Sustainability, Uber
May 7, 2025


ZEV 기사
Globally, more than 230,000 ZEV drivers were active on Uber’s app in Q1 2025. That’s over 60% more than the same period a year earlier.
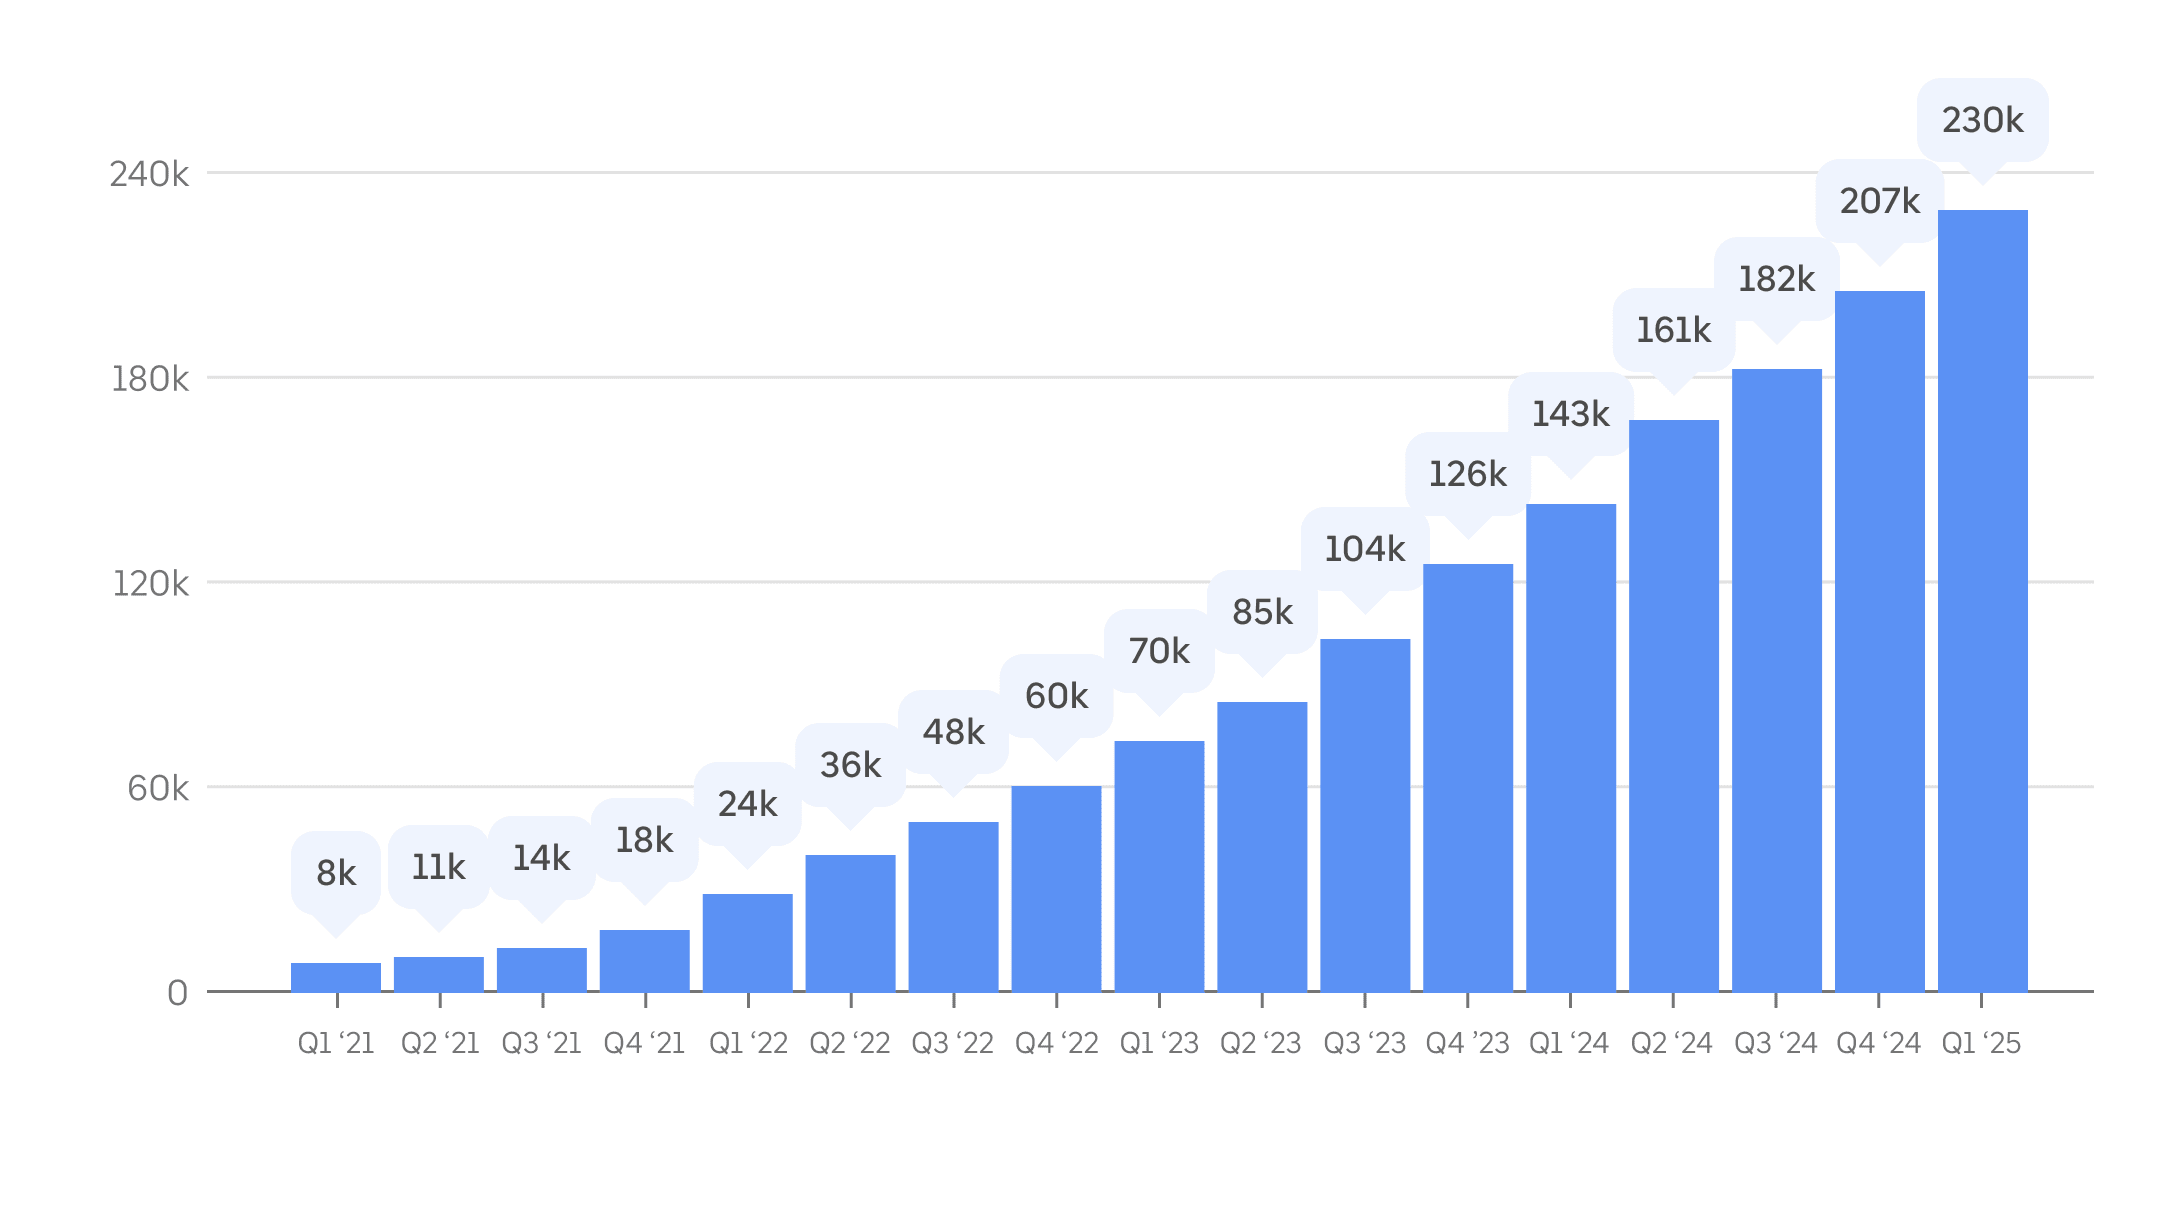
Metric: Average monthly active ZEV drivers on Uber, by quarter, since Q1 2021. Drivers using Uber’s app are counted as active in a given month if they’ve completed at least one trip in that calendar month.
ZEV 운행
In Q1 2025, ZEV drivers completed over 105 million tailpipe-emissions-free trips using Uber, globally—over 60% more than the number of ZEV trips completed on Uber during the same period a year earlier. That’s more than 13 ZEV trips on Uber every second, on average.
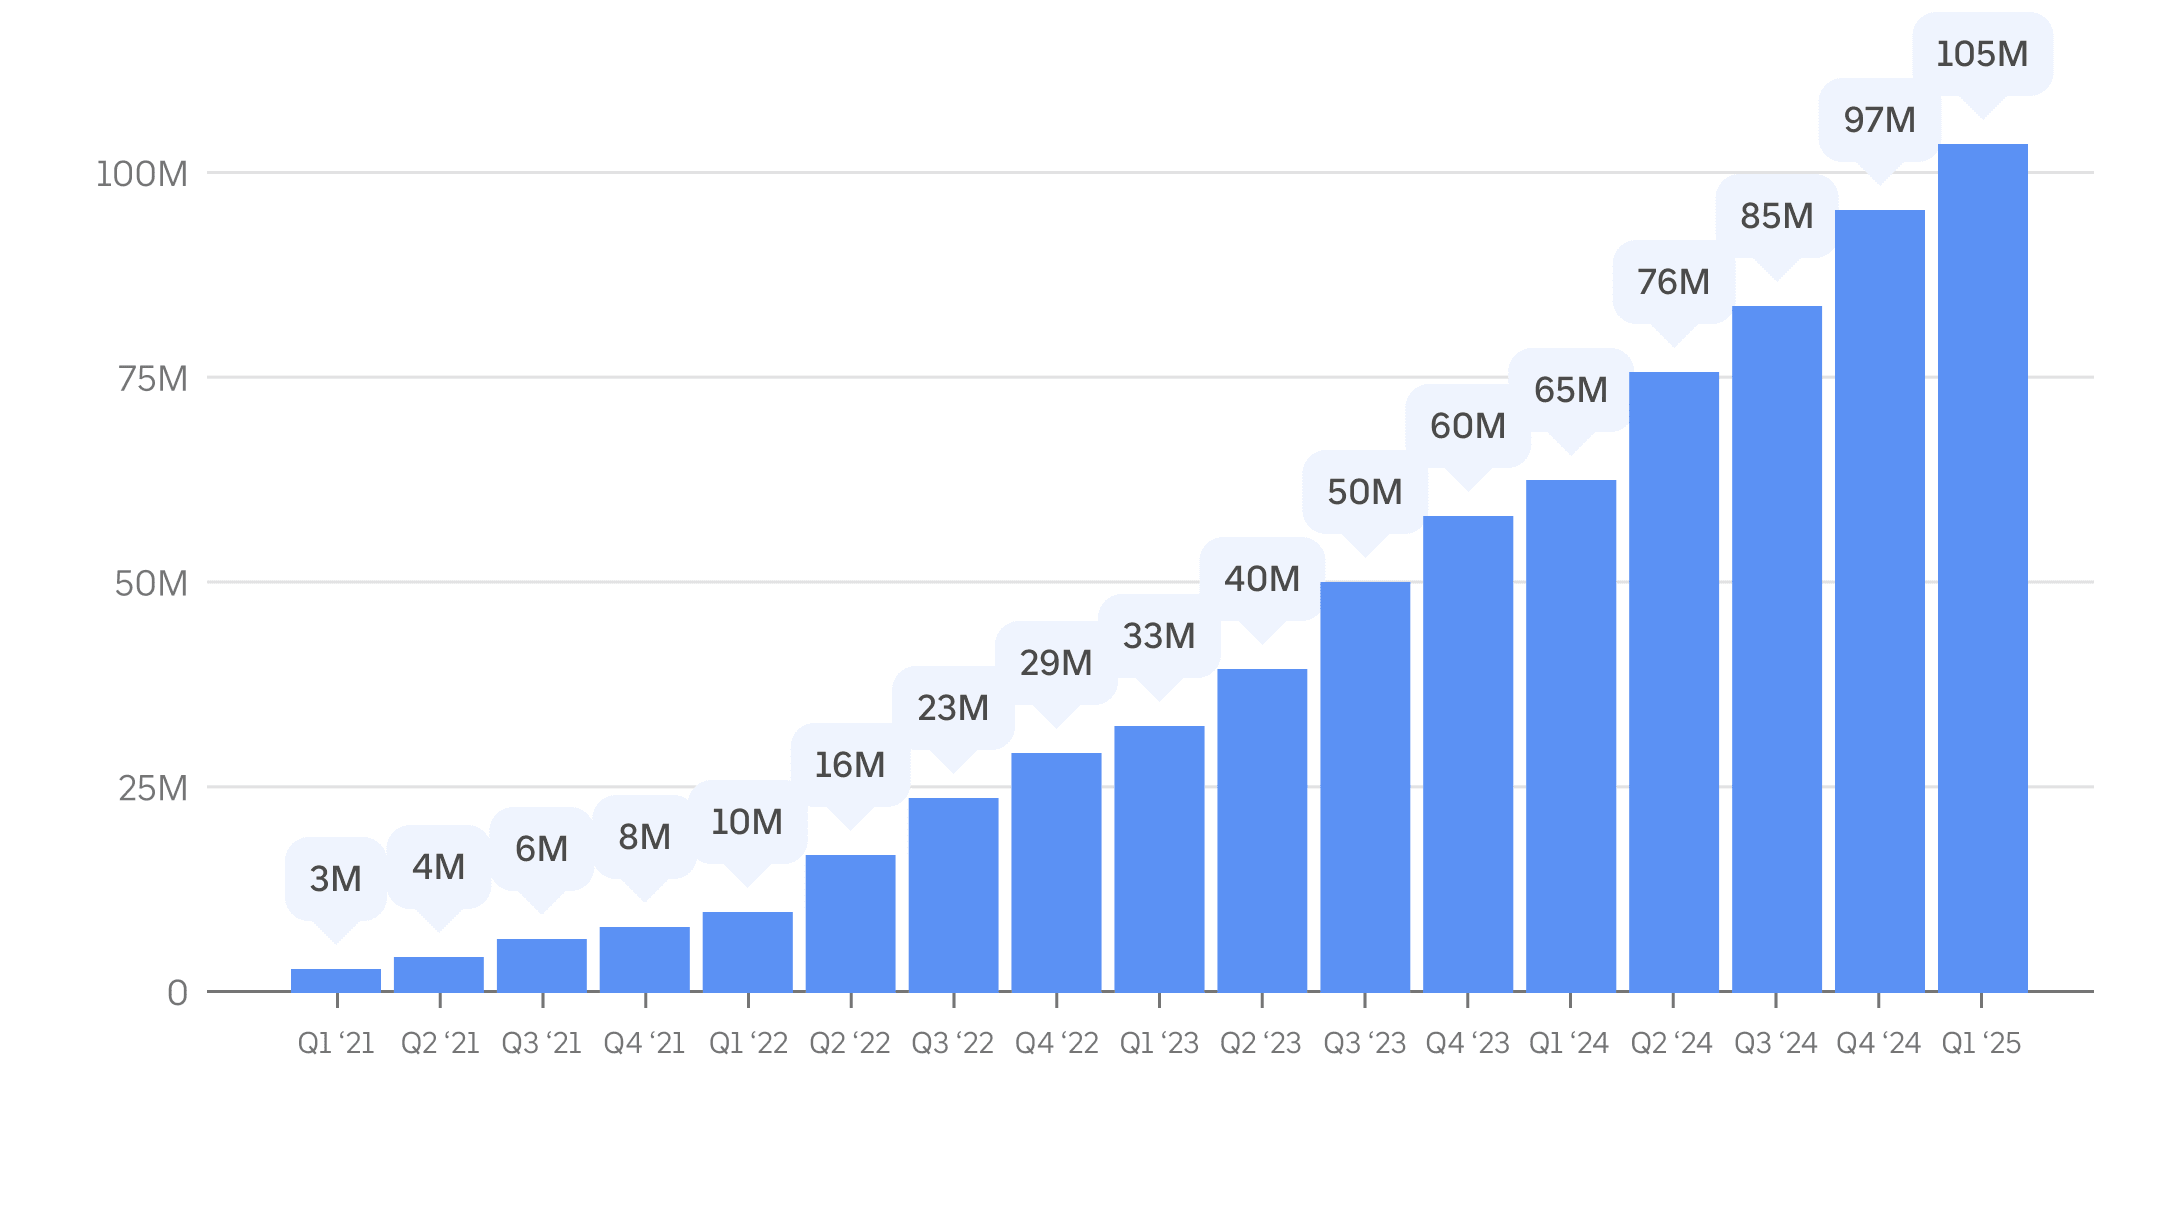
지표: 2021년 1분기 이후 Uber 앱에서 이루어진 ZEV 차량 서비스 운행 횟수를 분기별로 정리한 것입니다.
ZEV 활용도
In Q1 2025, ZEV drivers completed 15.3% of all on-trip miles in Europe and 9.1% of all on-trip miles in Canada and the US—adoption levels many times above drivers in the general public. Figures published in a 2024 BloombergNEF report show that ZEV uptake by Uber drivers in Europe was about 5 times faster than that of typical motorists.
Over the last 4 years, the average annual increase in all-electric on-trip mileage share on Uber in Europe and in the US and Canada was 3.1 and 2.2 percentage points, respectively. The highest and lowest annual increases recorded over that period occurred in the last year: since Q1 2024, ZEV uptake jumped more than 6 percentage points in Europe and just under 1 in the US and Canada.
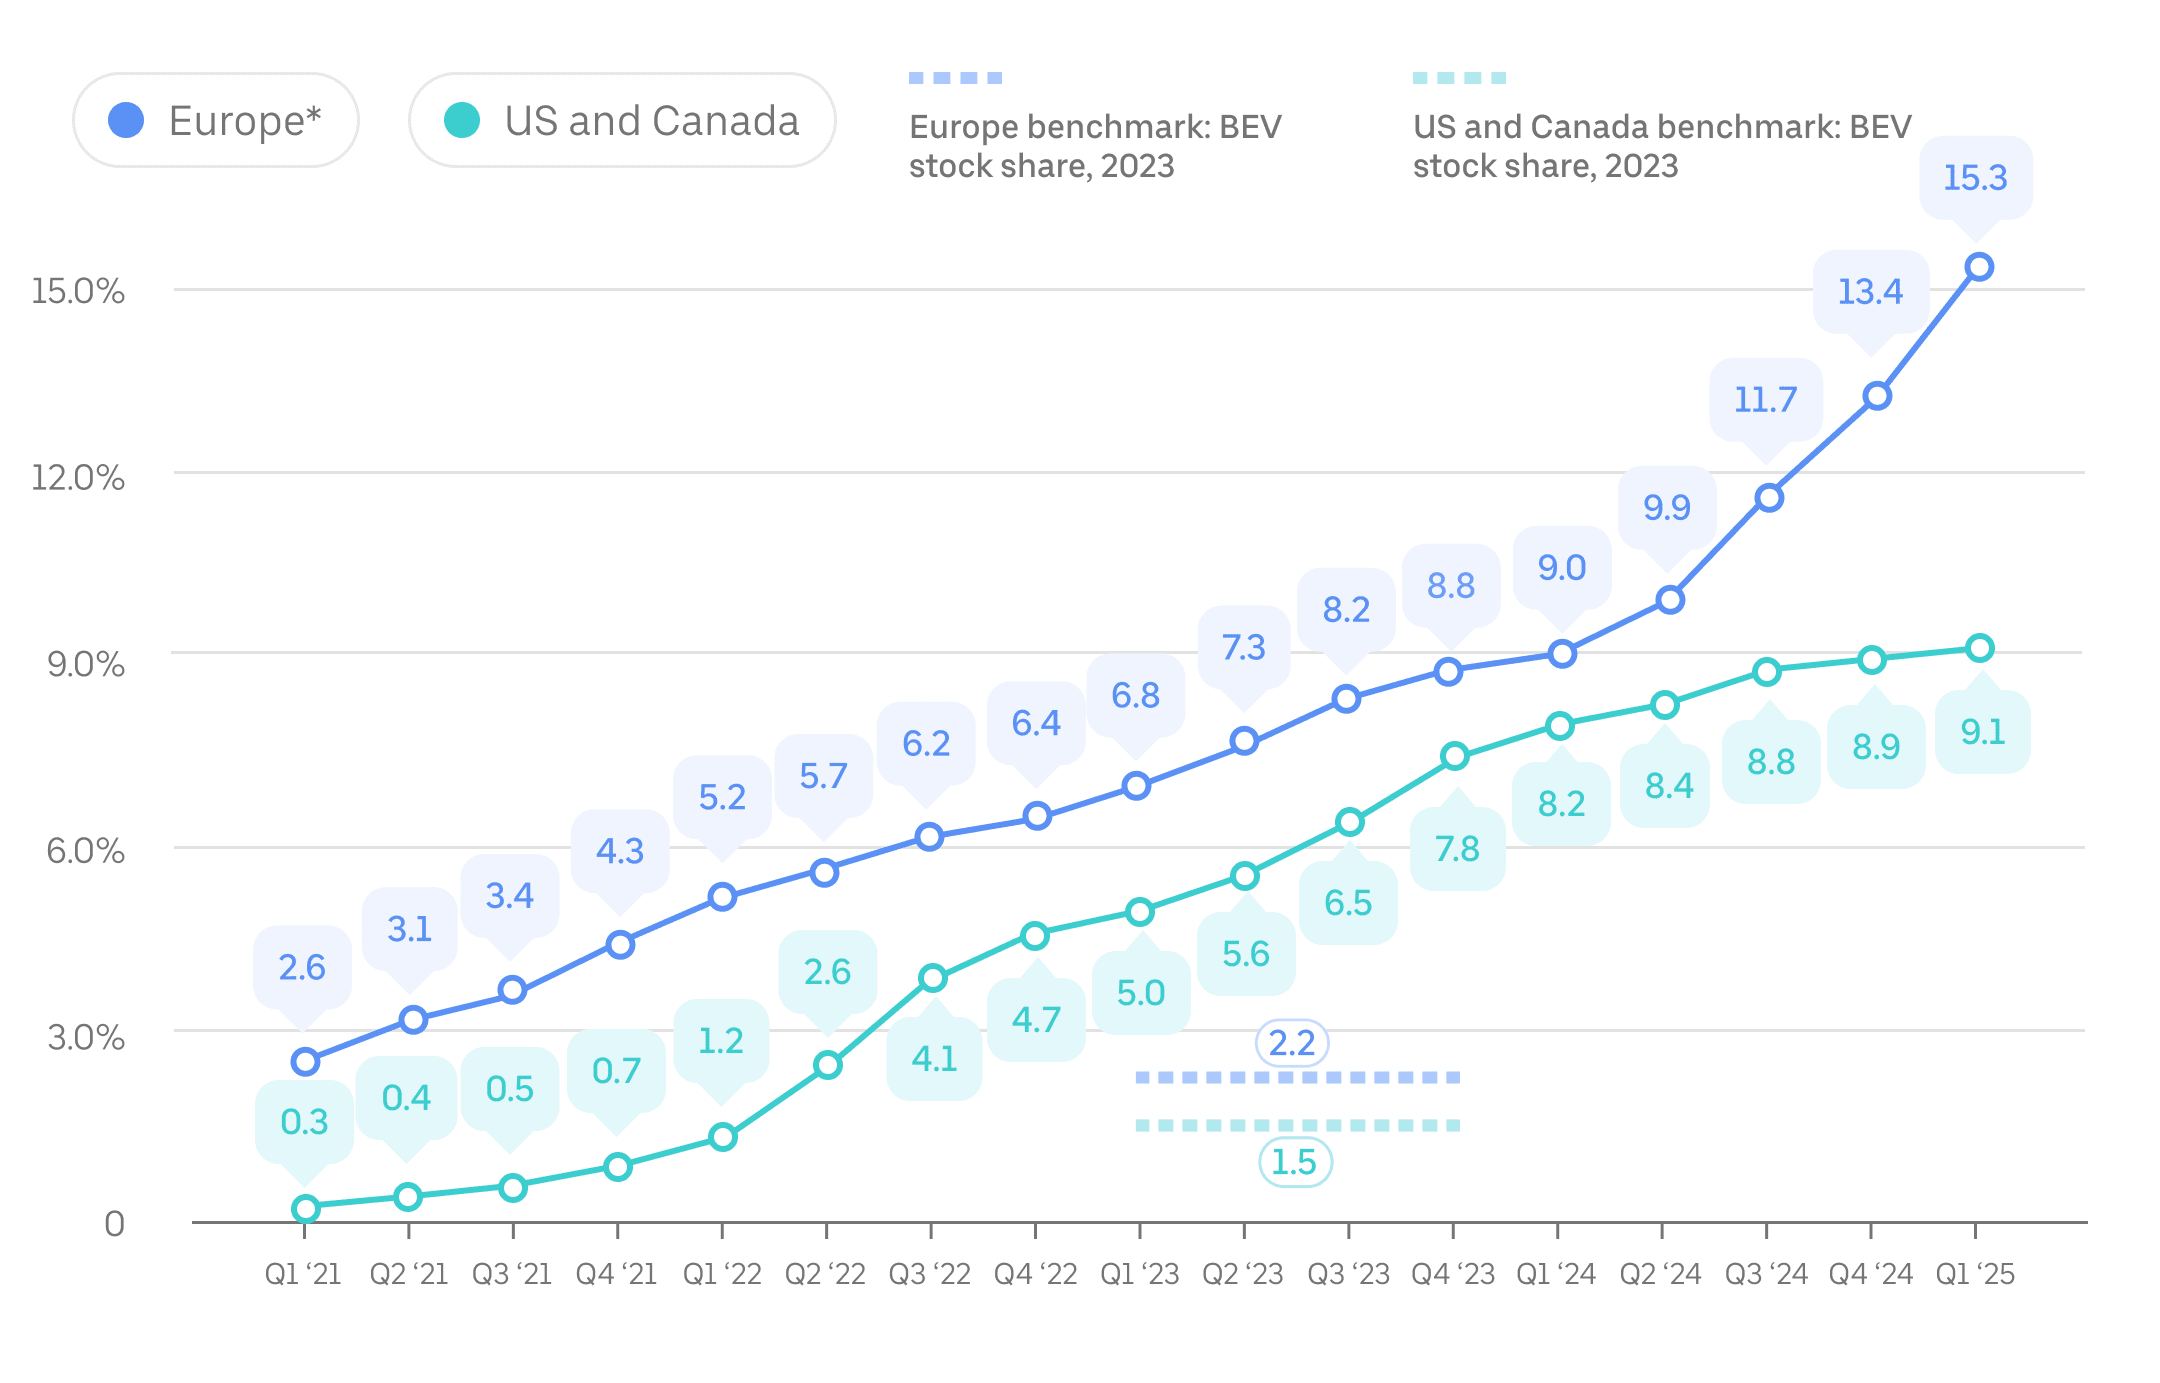
Metric: Share of on-trip miles completed in ZEVs compared with all on-trip miles arranged by the Uber app, by quarter since Q1 2021. Canada, US, and European benchmark data is as of 2023 (the most recently available at the time of this update) and is sourced from the International Energy Agency. “BEV” refers to battery electric vehicles.
승객 탄소 집약도
In 2024, each mile that a passenger traveled on Uber resulted in an average generation of 197 grams of CO₂ in Europe (or 123 grams of CO₂ per kilometer) and 340 grams of CO₂ in the US and Canada (or 212 grams of CO₂ per kilometer). Compared with 2021, this passenger carbon intensity metric fell nearly 14% in Europe and 6% across the US and Canada.
Passenger carbon intensity in Europe, the US, and Canada increased slightly between 2023 and 2024 due to minor decreases in average passenger occupancy and increases in “deadheading” (vehicle mileage incurred before and on the way to picking up passengers).
Metric: Passenger carbon intensity, or the estimated grams of CO₂ per passenger mile traveled, is an annual efficiency metric used by Uber—and, increasingly, governments and companies around the world. In the case of ridesharing, or any on-demand mobility service, emissions produced by any deadhead miles are factored into the calculation.
For more details about how we calculate passenger carbon intensity, go to our methodology document. Note that significantly lower average fuel economy for vehicles on Uber in Europe versus the US and Canada explains most of the difference in carbon intensity in these 2 geographies. While the composition of vehicles that drivers use on Uber’s app in Europe is more efficient (with a higher proportion of ZEVs and hybrids), more-stringent fuel economy reporting standards in the US also contributes to this discrepancy. In addition, we lack access to sufficient input data to calculate passenger carbon intensity for trips completed in European markets before 2021.
자주 묻는 질문
- What is in Uber’s Electrification Update?
Our Electrification Update provides interested stakeholders with performance-based metrics on carbon-related emissions and electrification for passenger vehicle trips enabled by the Uber app.
- Why are you publishing this update?
This update, based on real-world use of our mobility platform, helps provide greater transparency of our electrification impact and helps us improve our efforts to support efficiency on our platform.
- What are the key measurements you use in the Electrification Update?
지표에 포함되는 사항:
- Uber 플랫폼 기사님의 무공해 차량(ZEV) 채택률: 총 운행 거리 중에서 ZEV 운행 거리(마일 또는 킬로미터)가 차지하는 비중. 이 수치는 2040년까지 전 세계 100% 무배출 모빌리티를 목표로 하는 Uber의 성과를 측정하는데 사용됩니다.
- 승객 탄소 집약도: 승객이 1마일 이동할 때마다 발생하는 배출량을 측정합니다.
- How will this update improve emissions reduction and electrification uptake for rides on Uber?
We have bold ambitions to reduce the passenger carbon intensity of trips and increase the use of zero-emission vehicles on Uber. Measurement and transparency of the progress are important steps along our journey.
- 승객이 대중교통과 같은 저탄소 교통수단 대신 Uber 차량 서비스를 이용하나요?
Uber 앱을 통한 차량 서비스는 차량 서비스를 찾는 사람들이 이용할 수 있는 다양한 교통수단 중 하나입니다. 선택 가능한 운행 수단은 다양한 현지 시장 상황에 따라 달라집니다. 미국의 전국 가구 여행 실태 조사 데이터에 대한 Uber의 분석 결과는 지속 가능한 교통수단(대중교통, 도보, 자전거)의 가구당 이용률이 높아질수록 승차 공유 및 기타 온디맨드 솔루션의 이용률이 높아진다는 것을 보여줍니다.
- 전 세계의 다양한 국가나 지역에서 동일한 데이터가 측정되나요?
Many of the above metrics now cover all passenger trips completed with the Uber app globally. We’re aligned to regular reporting on carbon emissions and other impact areas resulting from trips on Uber.
- With what frequency do you expect to provide Uber’s Electrification Update?
We update metrics at least annually and may update some metrics more frequently. We’ll release emissions metrics (like passenger carbon intensity) annually, aggregated by calendar year.
- ‘무배출 차량’이란 무엇을 의미하나요?
Uber는 '무배출 차량(ZEV)'이라는 용어를 캘리포니아 대기 자원 위원회(CARB) 및 유럽의 교통&환경(T&E)과 같은 방식으로 사용합니다. 즉, 탑재된 동력원에서 직접적으로 CO2 또는 기타 기준의 대기 오염 물질(예: NOx, 미세먼지, CO₂, SOx)을 배출하지 않는 차량을 의미합니다. 독자는 지역별 차이를 감안해야 합니다.
Uber 앱을 이용하는 기사는 현재 배터리 전기차(배터리 EV)와 아주 드문 경우 수소 연료 전지 전기차(FCEV)의 두 가지 ZEV 유형을 사용합니다.
물론 ZEV에서 '무배출'이란 차량의 '배기관'에서 배출되는 물질이 없음을 의미하며, 차량 및 차량이 사용하는 에너지원의 생산에서 폐기에 이르는 과정에서 발생하는 모든 배출을 의미하는 것은 아닙니다. 그러나 그 모든 과정을 감안하더라도, 제3자 전문가의 수명 주기 분석에 따르면 “현재 등록된 평균적인 중형 배터리 EV의 전체 수명 기간의 배출량은 유사한 비교군의 휘발유 차량에 비해 유럽에서 66~69%, 미국에서 60~68%, 중국에서 37~45%, 인도에서 19~34% 더 낮습니다.”
- Will you measure impact for your Delivery business?
Our Electrification Update currently covers electrification and emissions metrics only for our Mobility business (ridesharing). We aim to include our progress on delivery emissions and electrification in future.
On packaging, Uber continues to invest in helping merchants transition to sustainable options. However, as with electrification, progress depends on collective action. We’re prioritizing efforts in cities where public and private investments are aligned. For example, in France over 60% of packaging used on the platform is recyclable, reusable, or compostable, supported by national policy and local incentives.
While progress has been made, based on current trends, we cannot meet all 2025 goals, and our 2030 goals will be out of reach without stronger, coordinated action across government and industry.
While many key levers are outside our control, we remain deeply committed to this transition. To learn more about Uber’s approach to more sustainable packaging with merchants, consult our Uber Eats for Merchants web page.
- Uber는 스코프 1, 2, 3 배출량을 공개하나요? 그렇다면, 이 정보를 어디에서 확인할 수 있나요?
Uber discloses Scope 1, 2, and 3 emissions to CDP. You can find our most recent score in CDP’s public corporate score search. These emissions estimates have received limited assurance from an independent third party.
이 페이지와 관련 기후 영향 평가 및 성과 보고서, 환경·사회·거버넌스(ESG) 보고서(이하 '보고서')에는 Uber가 제시하는 향후 사업 기대치와 목표에 관해 위험성과 불확실성이 포함된 미래 예측적 진술이 포함되어 있습니다. 실제 결과는 예상 결과와 상당 부분 다를 수 있습니다. 자세한 내용은 보고서에서 확인하세요.
이 보고서에 공개된 일부 정보는 로이드인증원(LRQA)으로부터 제한적 보증을 받았습니다. LRQA의 인증서는 여기에서 확인하실 수 있습니다.
당사의 탄소 상쇄 사용에 대한 요약 정보는 여기에서 확인하실 수 있습니다.
이 보고서에서 사용하는 '기사', '배달 기사', '수입', '무공해 차량', '지속 가능한 포장'과 같은 용어는 일반적인 의미를 가지며, Uber Technologies, Inc.의 일반적인 용례를 따릅니다. 독자는 용어에 대한 지역별 차이를 감안해야 합니다.