Mise à jour sur le passage aux véhicules électriques d'Uber
Q3 2025 update: This page includes metrics for trips completed on Uber by internal combustion engine vehicles and zero-emission vehicles (ZEVs, such as battery EVs) from the beginning of the first quarter of 2021 to the end of the third quarter of 2025. Note that the scope of this report includes only Uber’s Mobility business (ridesharing).
Suivre notre parcours vers l'objectif zéro émission
Five years into our ambitious efforts to transition to a zero-emission platform, we’ve made meaningful progress. Today, Uber is the world's most widely available platform for zero-emission rides, with drivers adopting EVs (electric vehicles) up to 5 times faster than average motorists in the US, Canada, and Europe.
We’ve invested hundreds of millions of dollars to help interested drivers make the switch to electric through incentives, partnerships, and product enhancements—and it’s paying off. Increasingly, riders are experiencing their first EV on Uber, helping to normalize and accelerate the adoption of electric transport all over the world.
Our data shows that EV progress quickens when government and industry work together to get the economics right. In cities like London, Vancouver, and Amsterdam, where thoughtful policies, industry investment, and strong charging networks align, more than 1 in every 3 miles on Uber are now electric.
Despite this significant progress, major barriers remain to fully achieving our goals. High upfront EV costs, limited charging access, and inconsistent policy support continue to slow adoption. Based on current trends, we cannot meet our remaining mobility and delivery goals for 2025, and our 2030 goals will be out of reach without stronger, coordinated action across government and industry.
As we’ve said from the start: Climate is a team sport, and progress depends on collective action. That’s why we’re increasingly prioritizing efforts in cities where public and private investment are aligned.
While many key levers are outside our control, we remain deeply committed to this transition—not just because it’s the right thing to do, but also because it brings direct and strategic business benefits. Thousands of drivers around the world are taking home more money thanks to lower EV operating costs and rider demand for electric vehicles. Riders report higher satisfaction with the EV experience and are increasingly choosing EVs.
And finally, the future is shared, electric, and autonomous—and the coming wave of autonomous (electric) vehicles will create a major tailwind in achieving our sustainability goals.
Our latest update below outlines the progress to date, key insights, and areas of focus for 2025 and beyond.
Chauffeurs ZEV
Globally, more than 286,000 ZEV drivers were active on Uber’s app in Q3 2025. That’s over 57% more than the same period a year earlier.
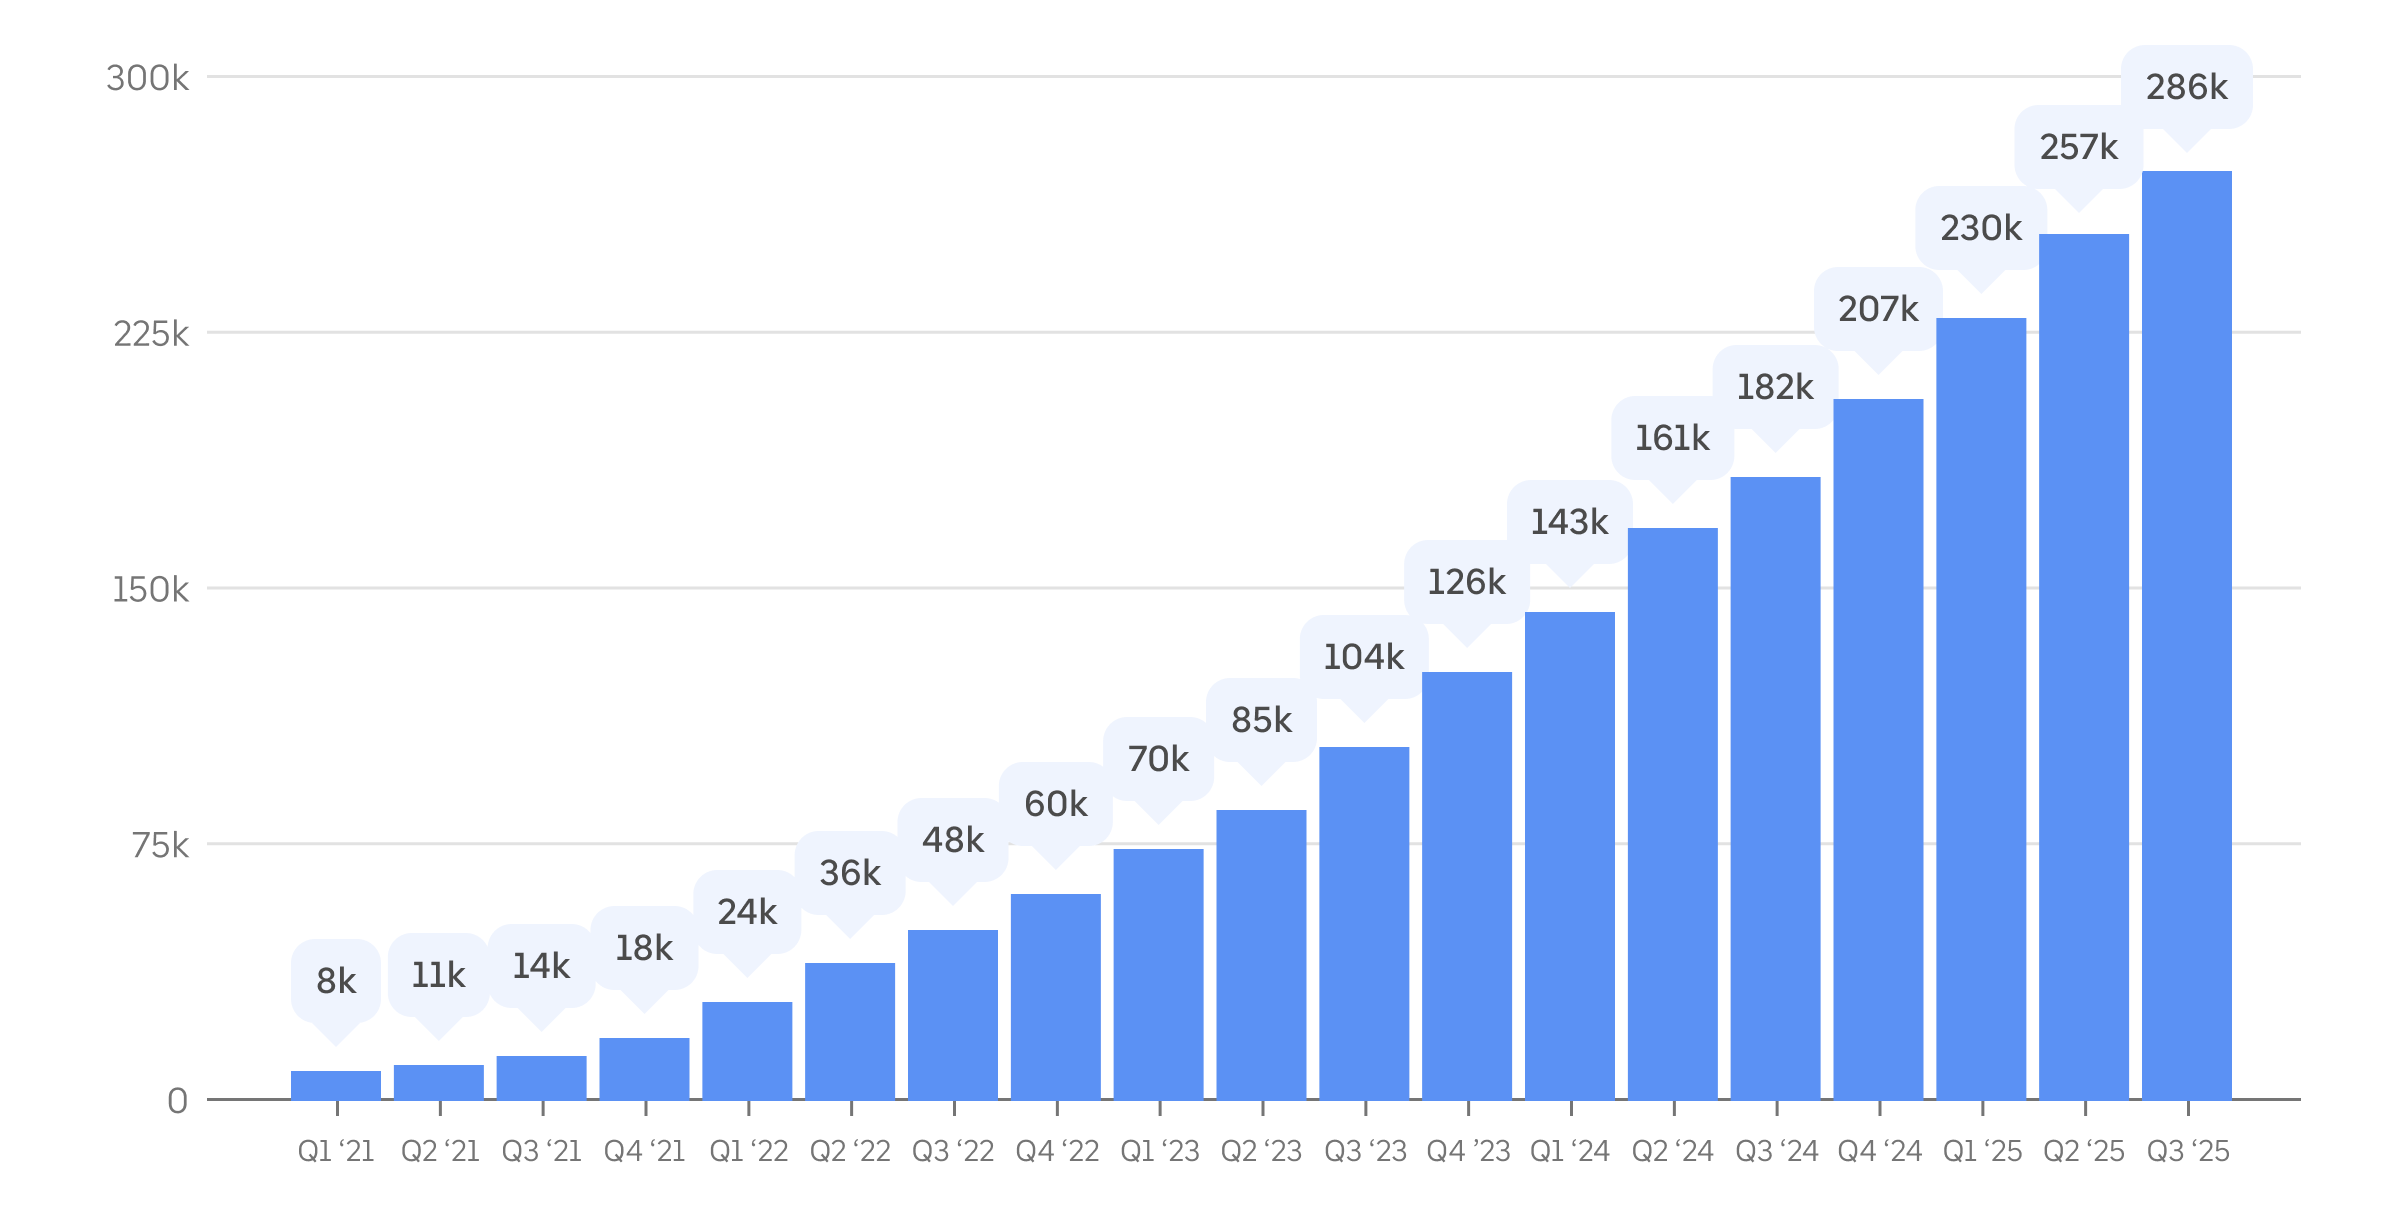
Indicateur : Chauffeurs de VZE actifs mensuels moyens sur Uber, par trimestre, depuis le premier trimestre 2021. Les chauffeurs qui utilisent l'application Uber sont considérés comme actifs au cours d'un mois donné s'ils ont effectué au moins un trajet au cours de ce mois civil.
Courses en VZE
In Q3 2025, ZEV drivers completed over 136 million trips using Uber, globally. That’s more than 17 ZEV trips on Uber every second, on average. The Q3 2025 total is 60% more than the number of ZEV trips completed on Uber during the same period a year earlier.
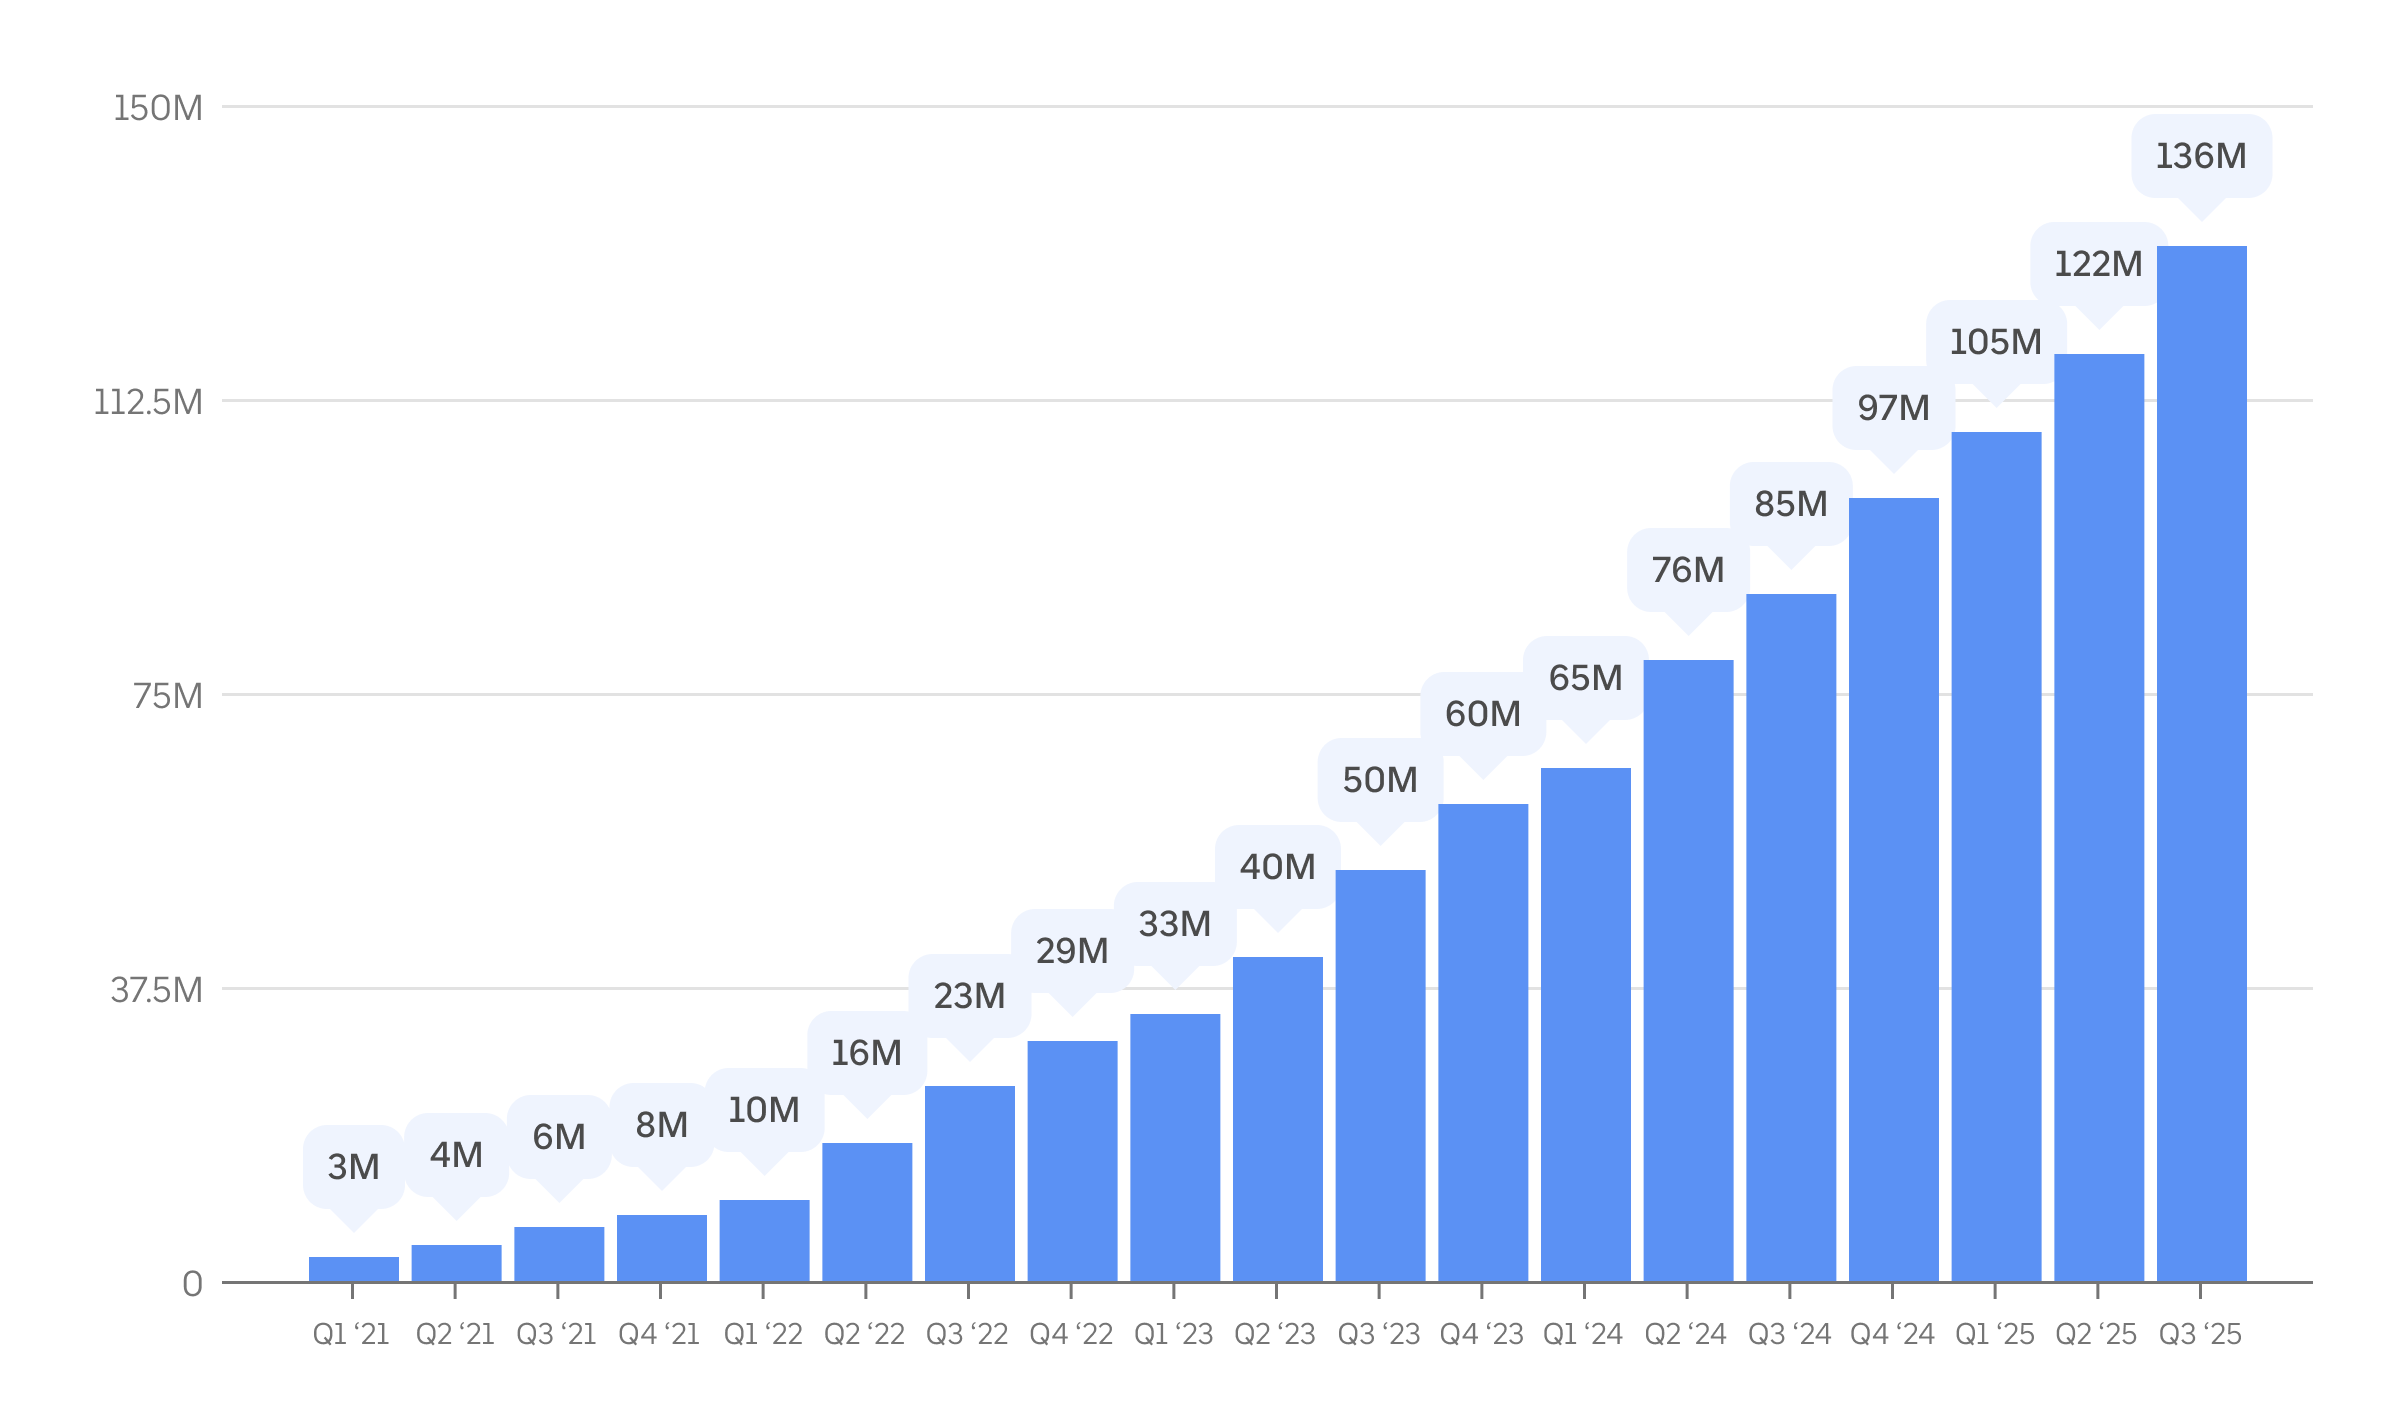
Indicateur : nombre de trajets organisés via l'application Uber et effectués par les chauffeurs de VZE, par trimestre depuis le premier trimestre 2021.
Adoption par le ZEV
In Q3 2025, ZEV drivers completed 16.8% of all on-trip miles in Europe and 9.5% of all on-trip miles in Canada and the US—adoption levels many times above drivers in the general public.
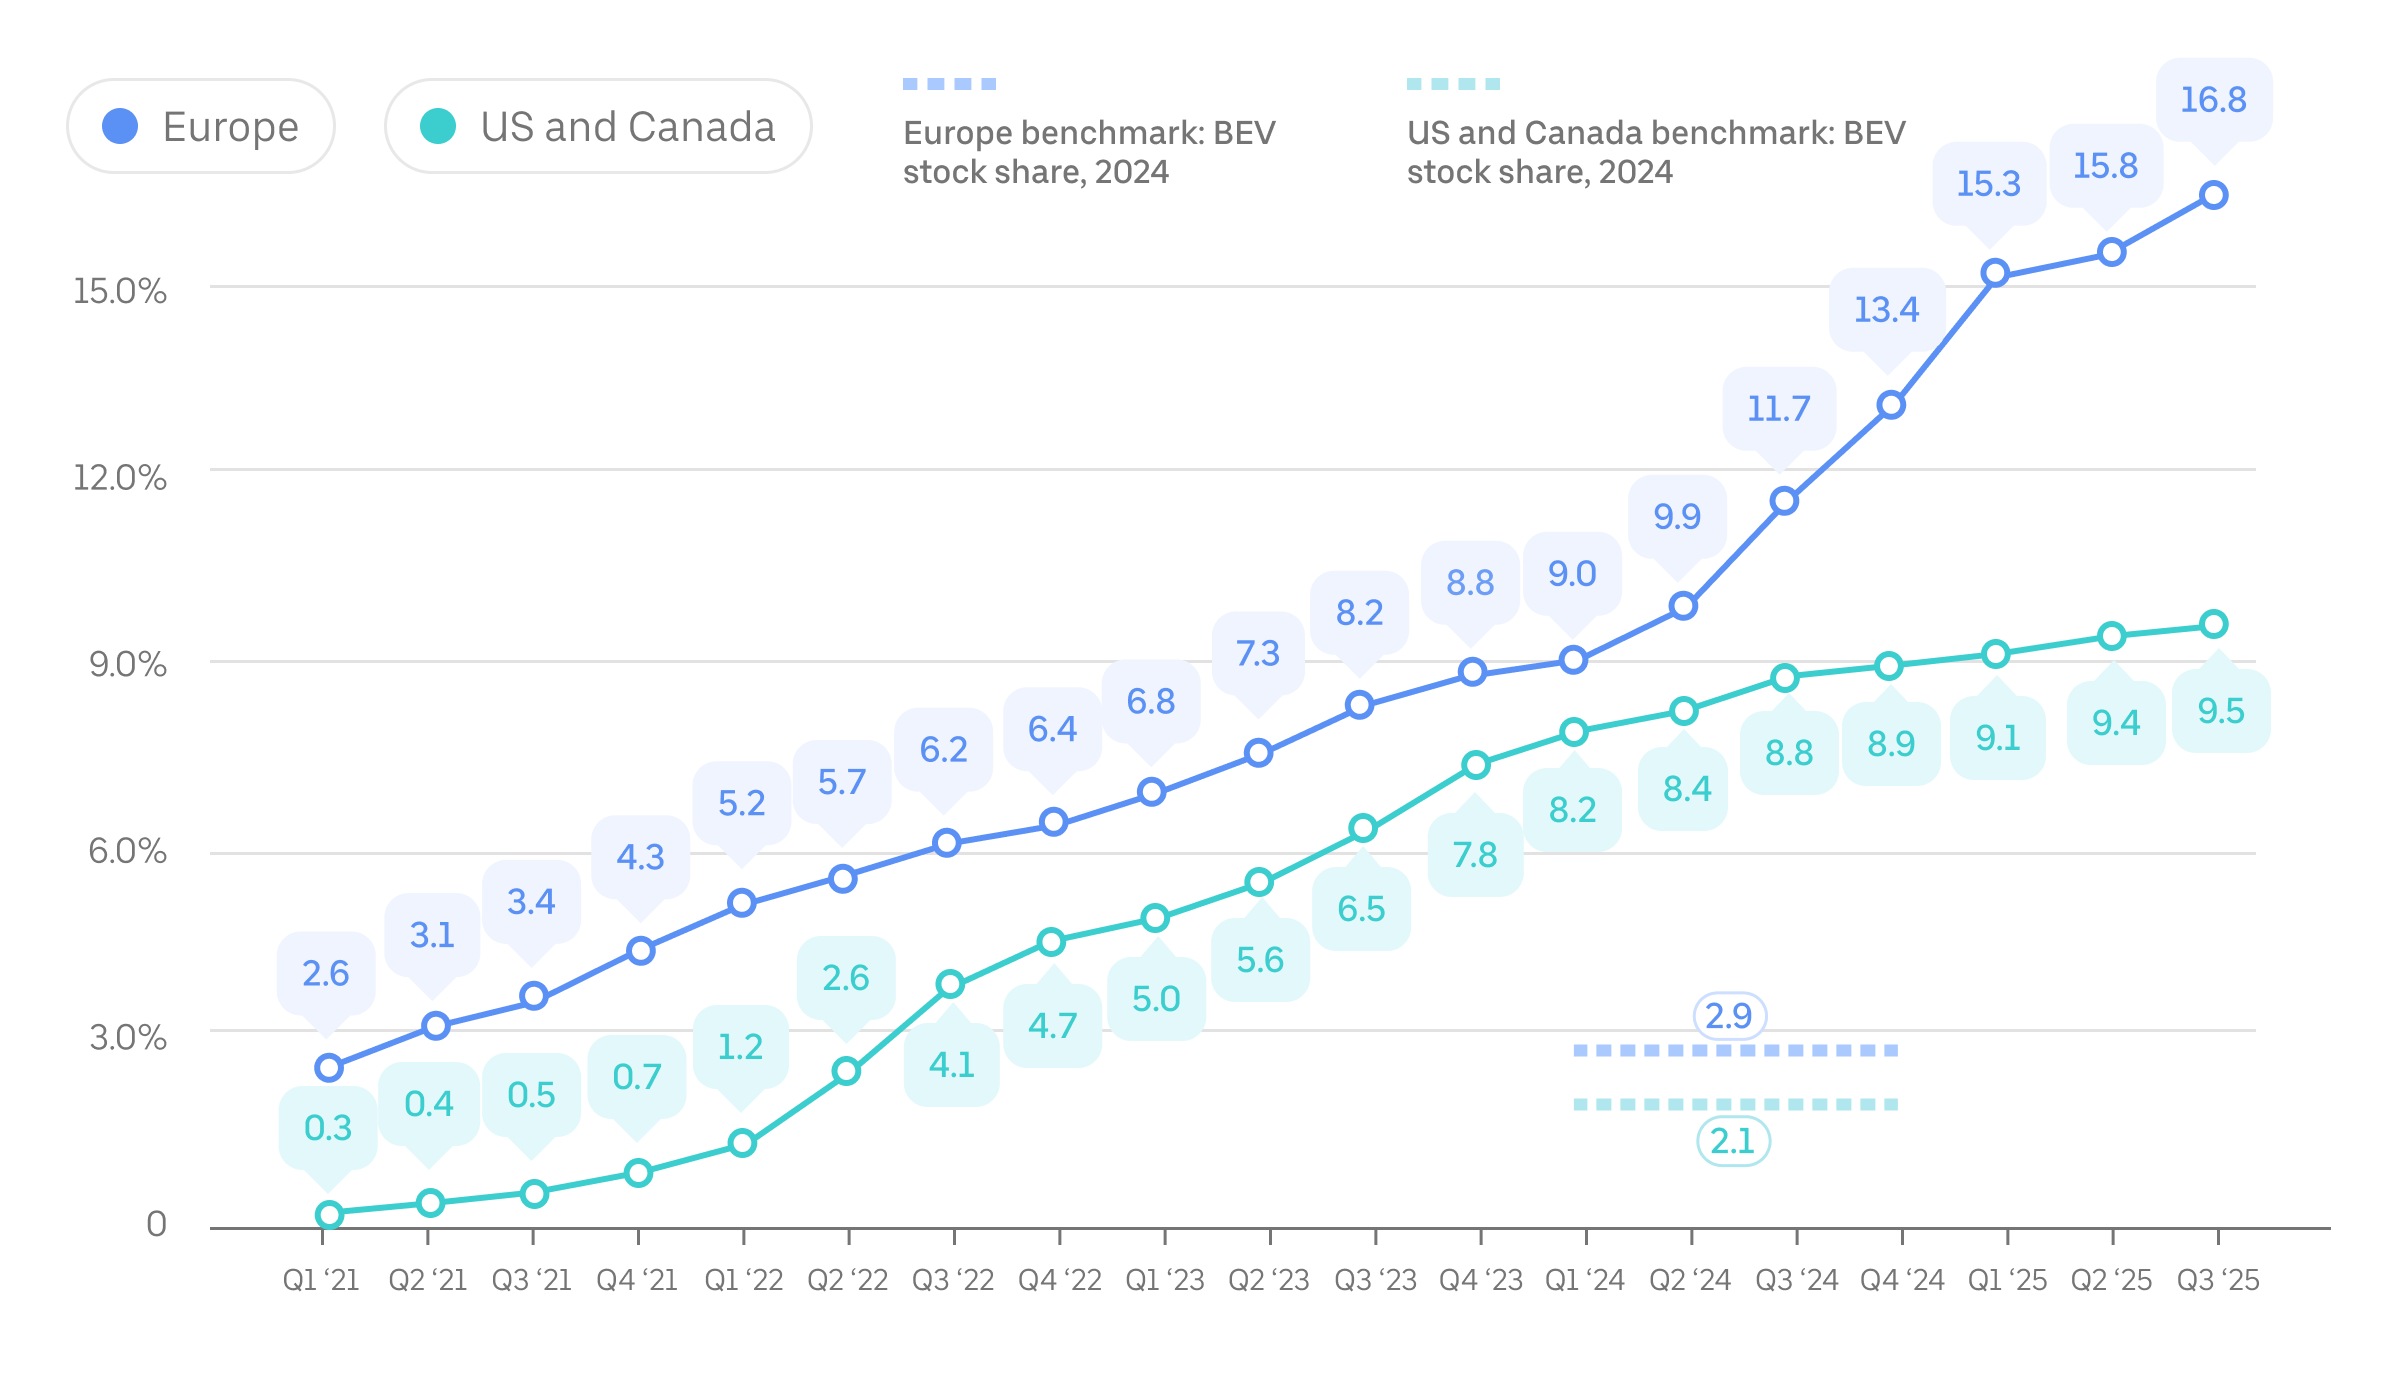
Metric: Share of on-trip miles completed in ZEVs compared with all on-trip miles arranged by the Uber app, by quarter since Q1 2021. Canada, US, and Europe benchmark data is as of 2024 (the most recently available at the time of this update) and is sourced from the International Energy Agency. “BEV” refers to battery electric vehicles.
Intensité carbone passager
En 2024, chaque mile parcouru par un passager avec Uber a généré en moyenne 197 grammes de CO₂ en Europe (soit 123 grammes de CO₂ par kilomètre) et 340 grammes de CO₂ aux États-Unis et au Canada (soit 212 grammes de CO₂ par kilomètre). Par rapport à 2021, cette mesure de l'intensité carbone passager a chuté de près de 14 % en Europe et de 6 % aux États-Unis et au Canada.
L'intensité carbone passager en Europe, aux États-Unis et au Canada a légèrement augmenté entre 2023 et 2024, en raison de baisses mineures du taux d'occupation moyen des passagers et d'augmentations de la « distance à vide » (kilométrage du véhicule avant et sur le chemin de la prise en charge des passagers).
Metric: Passenger carbon intensity, or the estimated grams of CO₂ per passenger mile traveled, is an annual efficiency metric used by Uber—and, increasingly, governments and companies around the world. In the case of ridesharing, or any on-demand mobility service, emissions produced by any deadhead miles are factored into the calculation.
For more details about how we calculate passenger carbon intensity, go to our methodology document. Note that significantly lower average fuel economy for vehicles on Uber in Europe versus the US and Canada explains most of the difference in carbon intensity in these 2 geographies. While the composition of vehicles that drivers use on Uber’s app in Europe is more efficient (with a higher proportion of ZEVs and hybrids), more-stringent fuel economy reporting standards in the US also contributes to this discrepancy. In addition, we lack access to sufficient input data to calculate passenger carbon intensity for trips completed in European markets before 2021.
Données et analyses approfondies
Say hello to Uber Electric (2025)
Electrifying ridehail in the US and Canada (2025)
Des véhicules électriques pour tous : adoption équilibrée d'une technologie en maturation (2024)
Faire du développement durable le meilleur choix (2024)
Comment aider à stimuler la mobilité électrique à travers l'Europe (2024)
Réduction des émissions grâce à un itinéraire durable (2023)
Mesurer l'intensité carbone de la mobilité (2019)
Foire aux questions
- Que contient la mise à jour sur le passage aux véhicules électriques d'Uber ?
Notre mise à jour sur le passage aux véhicules électriques fournit aux parties prenantes intéressées des indicateurs de performance sur les émissions de carbone et le passage aux véhicules électriques pour les trajets de passagers effectués via l'application Uber.
- Pourquoi publiez-vous cette mise à jour ?
Cette mise à jour, basée sur l'utilisation réelle de notre plateforme de mobilité, contribue à une plus grande transparence de l'impact de notre passage aux véhicules électriques et nous aide à améliorer nos efforts pour soutenir l'efficacité sur notre plateforme.
- Quels sont les indicateurs principaux utilisés dans la mise à jour sur le passage aux véhicules électriques ?
Les indicateurs sont les suivants :
- l'utilisation de véhicules zéro émission par les chauffeurs avec Uber (part des miles parcourus ou des kilomètres parcourus en VZE), qui mesure notre progression vers notre objectif de 100 % de mobilité zéro émission avec Uber dans le monde entier d'ici 2040 ;
- l'intensité carbone passager, qui mesure le taux d'émission des passagers par mile.
- Comment cette mise à jour va-t-elle améliorer la réduction des émissions et l'adoption des trajets en VE avec Uber ?
Nous avons l'ambition de réduire l'intensité carbone des trajets de passagers et d'augmenter l'utilisation de véhicules zéro émission sur la plateforme Uber. La mesure et la transparence des progrès réalisés sont des étapes importantes de notre parcours.
- Les passagers effectuent-ils des trajets avec Uber au lieu d'utiliser des options à faible émission de carbone comme les transports en commun ?
Les trajets avec l'application Uber sont l'un des nombreux moyens de transport proposés aux personnes qui cherchent à se déplacer. Le choix du trajet dépend en grande partie des conditions du marché local. Notre analyse des données de l'enquête nationale sur les déplacements des ménages aux États-Unis montre qu'une utilisation plus élevée par foyer des modes de transport les plus durables (transports publics, marche et vélo) est liée à une utilisation plus élevée des trajets partagés et d'autres solutions à la demande.
- Mesurerez-vous les mêmes données pour d'autres pays ou régions du monde ?
Many of the above metrics now cover all passenger trips completed with the Uber app globally. We regularly report on carbon emissions and other impact areas resulting from trips on Uber.
- À quelle fréquence prévoyez-vous de fournir la mise à jour d'Uber sur le passage aux véhicules électriques ?
Nous mettons à jour les indicateurs au moins une fois par an et pouvons en mettre certains à jour plus fréquemment. Nous publierons des indicateurs d'émissions (comme l'intensité carbone passager) chaque année, agrégés par année civile.
- Qu'entendez-vous par « véhicule zéro émission » ?
We use the term “zero-emission vehicle” (ZEV) the same way the California Air Resources Board (CARB) and Europe’s Transport & Environment (T&E) do: to refer to vehicles that produce no direct CO₂ emissions or other criteria air pollutants (such as NOx, particulate matter, CO₂, and SOx) from the on-board source of power. Regional variations should be considered at the reader’s discretion.
Drivers using Uber’s app use 2 types of ZEVs today: battery electric vehicles (battery EVs) and, very occasionally, hydrogen-powered fuel cell electric vehicles (FCEVs).
Of course, the “zero” in ZEV refers to no emissions from the proverbial “tailpipe” of the vehicle and not necessarily all the emissions that can be accounted for from production to disposal of the vehicle and its energy source. All accounted for, however, life-cycle analyses by independent experts show that “emissions over the lifetime of average medium-size battery EVs registered today are already lower than comparable gasoline cars by 66%–69% in Europe, 60%–68% in the United States, 37%–45% in China, and 19%–34% in India.”
- Allez-vous mesurer l'impact sur votre activité de livraison ?
Our Electrification Update currently covers electrification and emissions metrics only for our Mobility business (ridesharing). We aim to include our progress on delivery emissions and electrification in the future.
In terms of packaging, Uber continues to invest in helping merchants transition to sustainable options. As with electrification, however, progress depends on collective action. We’re prioritizing efforts in cities where public and private investments are aligned. For example, in France over 60% of packaging used on the platform is recyclable, reusable, or compostable, supported by national policy and local incentives.
While progress has been made, based on current trends we cannot meet all 2025 goals, and our 2030 goals will be out of reach without stronger, coordinated action across government and industry.
While many key levers are outside our control, we remain deeply committed to this transition. To learn more about Uber’s approach to more-sustainable packaging with merchants, consult our Uber Eats for Merchants web page.
- Uber publie-t-il ses émissions de catégories 1, 2 et 3 et, dans l'affirmative, où les trouver ?
Uber discloses Scope 1, 2, and 3 emissions in our Governance Strategy and Engagement Report and to CDP. You can find our most recent score in CDP’s public corporate score search. These emissions estimates have received limited assurance from an independent third party.
This page and the related information, updates, reports, and web pages (the “Report”) contain forward-looking statements regarding our future business expectations and goals, which involve risks and uncertainties. Actual results may differ materially from the results anticipated. Additionally, this Report is provided for informational purposes only and should not be relied upon for business or vehicle acquisition decisions. Undue reliance should not be placed on the forward-looking statements. We undertake no duty to update this information unless required by law. For more information on Uber’s strategy, please go to investor.uber.com.
Certain data disclosed in this Report has received limited assurance from LRQA. Data discrepancies with assurance may be present due to rounding methodologies.
The use of terms in this Report such as “drivers,” “couriers,” “earn,” “zero- emission vehicle,” and “sustainable packaging” are general and follow the general use case of the words by Uber Technologies, Inc. Regional variations of words should be considered at the reader’s discretion.
An overview of Uber's use of carbon offsets can be found here.
À propos
À propos