Uber का विद्युतीकरण अपडेट
Q3 2026 update: This page includes metrics for trips completed on Uber by internal combustion engine vehicles and zero-emission vehicles (ZEVs, such as battery EVs) from the beginning of the first quarter of 2021 to the end of the third quarter of 2026. Note that the scope of this report includes only Uber's Mobility business (ridesharing).
जीरो एमिशन के हमारे सफ़र पर नज़र रखना
Six years into our ambitious efforts to transition to a zero-emission platform, we’ve made meaningful progress. Uber is already the world's most widely available platform for zero-emission rides, with drivers on Uber electrifying up to 5 times faster than the average motorist in Canada, Europe, and the US. For the first time in Q3 2026, zero-emission vehicles accounted for more than one in five on-trip miles on Uber in Europe and one in ten in the US&C.
We've invested hundreds of millions of dollars into electrification-related programs, incentives, partnerships, and product enhancements—and it's paying off. Thousands of drivers around the world are taking home more money thanks to lower electric vehicle (EV) operating costs and higher rider demand for electric vehicles. Increasingly, riders are experiencing their first EV on Uber, helping to normalize and accelerate the adoption of electric transport all over the world. Based on Uber's rider satisfaction survey, some of riders' highest satisfaction ratings come from the EV experience, and riders are increasingly choosing electric rides.
Our data shows that progress quickens when government and industry work together to get the economics right. Where thoughtful policies, industry investment, and strong charging networks align, electric miles on Uber are growing. For example, EV miles on Uber are now over 50% in Amsterdam, over 40% in London, and over 35% in Vancouver.
In recent months we have seen even more encouraging signs, with the largest quarterly increases in EV miles recorded across the US and Canada since 2023 and continued strong growth in Europe. However, despite significant progress, major barriers remain to achieving full-scale electrification. High upfront EV, financing, and insurance costs; charging access and complexity; and inconsistent policy environments continue to hinder adoption. As a result, we’ve not fully met our mobility and delivery goals for 2025 and, based on current trends, our 2030 goals continue to be out of reach without stronger, coordinated action across government and industry.
Across much of the world, EV adoption is growing, and governments in many markets are introducing new incentives to support the transition. We believe the future is electric and we will continue to invest in this transition, particularly where public and private investment are aligned.
While many key levers are outside our control, we remain deeply committed to this transition not just because it’s the right thing to do, but also because it brings direct and strategic benefits to our business, our users, our cities, and our wider communities. Our investments in expanding access to affordable charging infrastructure will support electrification and autonomy in the cities where Uber is available, and the coming wave of autonomous (electric) vehicles will create a major tailwind in achieving electrification at scale.
Our latest update below outlines the progress to date, key insights, and areas of focus for 2026 and beyond.
Pradeep Parameswaran
Head of Mobility, Uber
November 9, 2026
ZEV ड्राइवर्स
Globally, more than 434,000 ZEV drivers were active on Uber's app in Q3 2026. That's almost 52% more than the same period a year earlier.
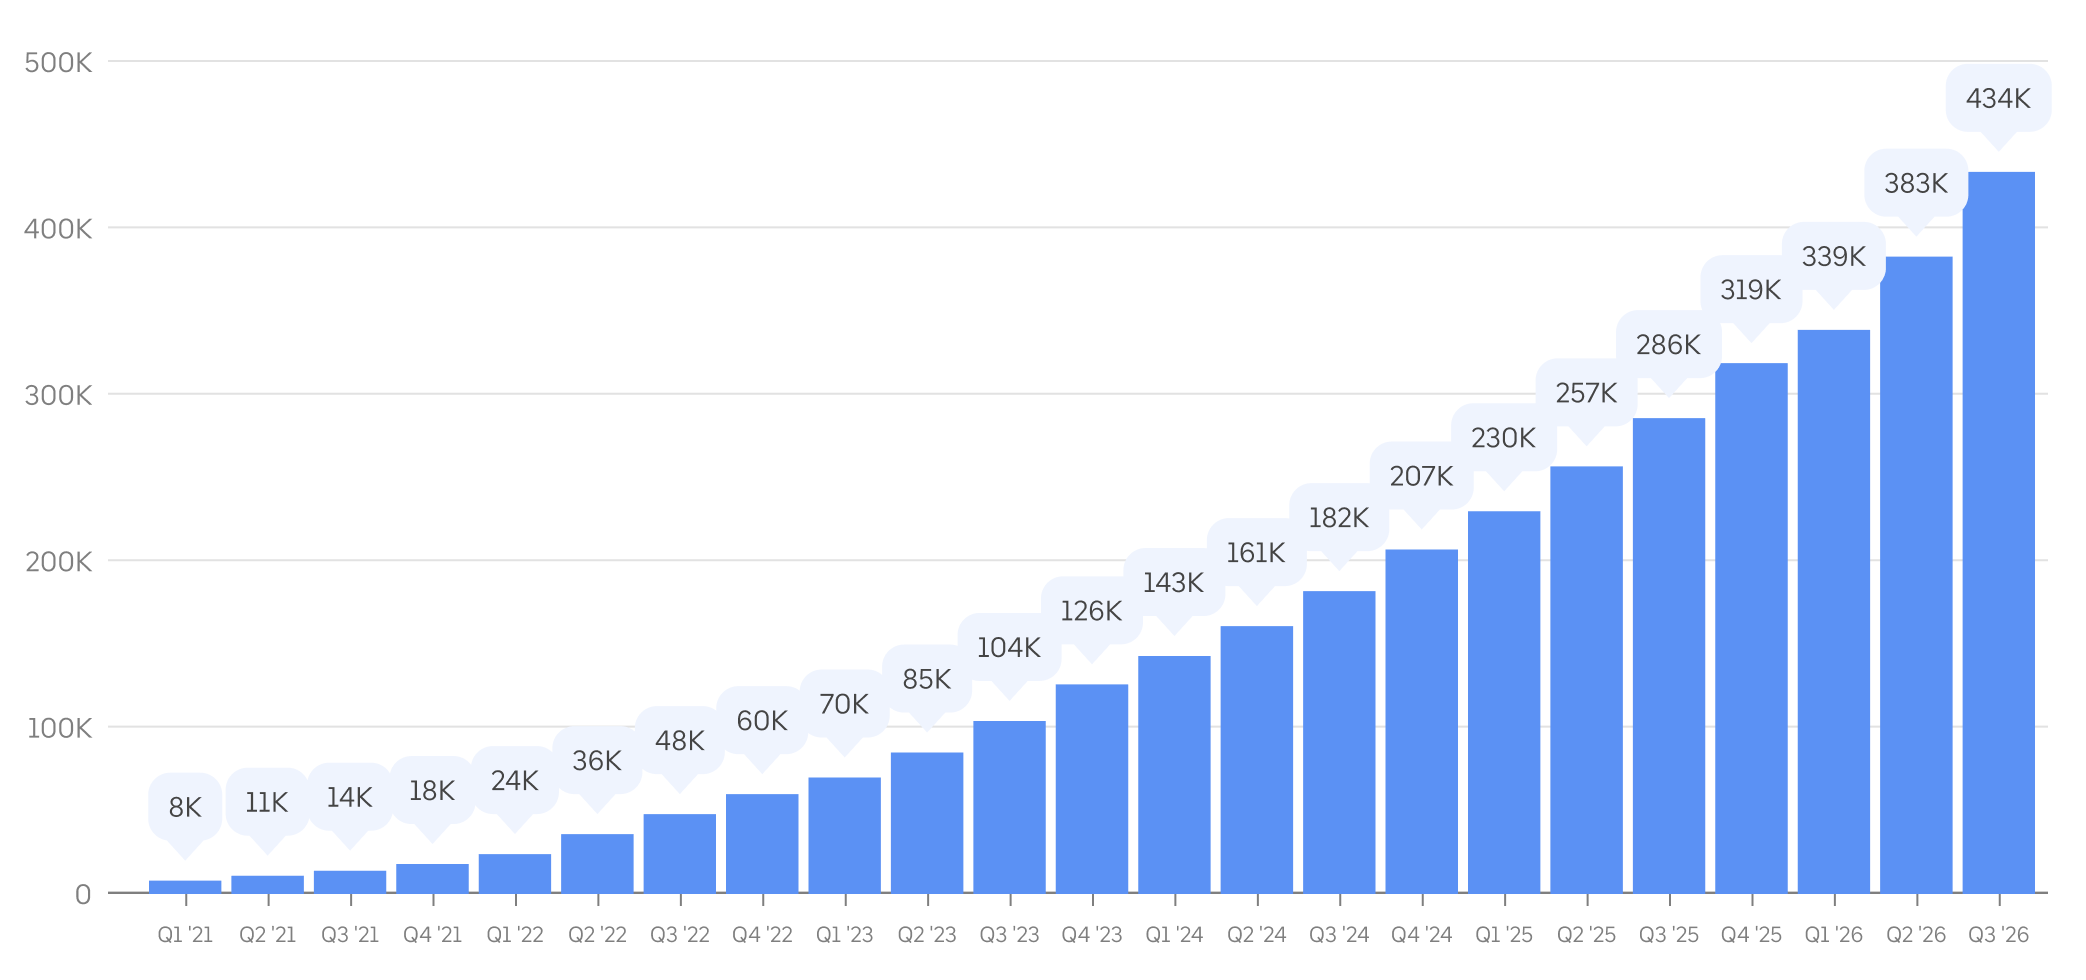
Metric: Average monthly active ZEV drivers on Uber, by quarter, since Q1 2021. Drivers using Uber's app are counted as active in a given month if they've completed at least one trip in that calendar month.
ZEV ट्रिप
In Q3 2026, ZEV drivers completed over 207 million trips using Uber, globally. That's over 26 ZEV trips on Uber every second, on average. The Q3 2026 total is 52% more than the number of ZEV trips completed on Uber during the same period a year earlier.
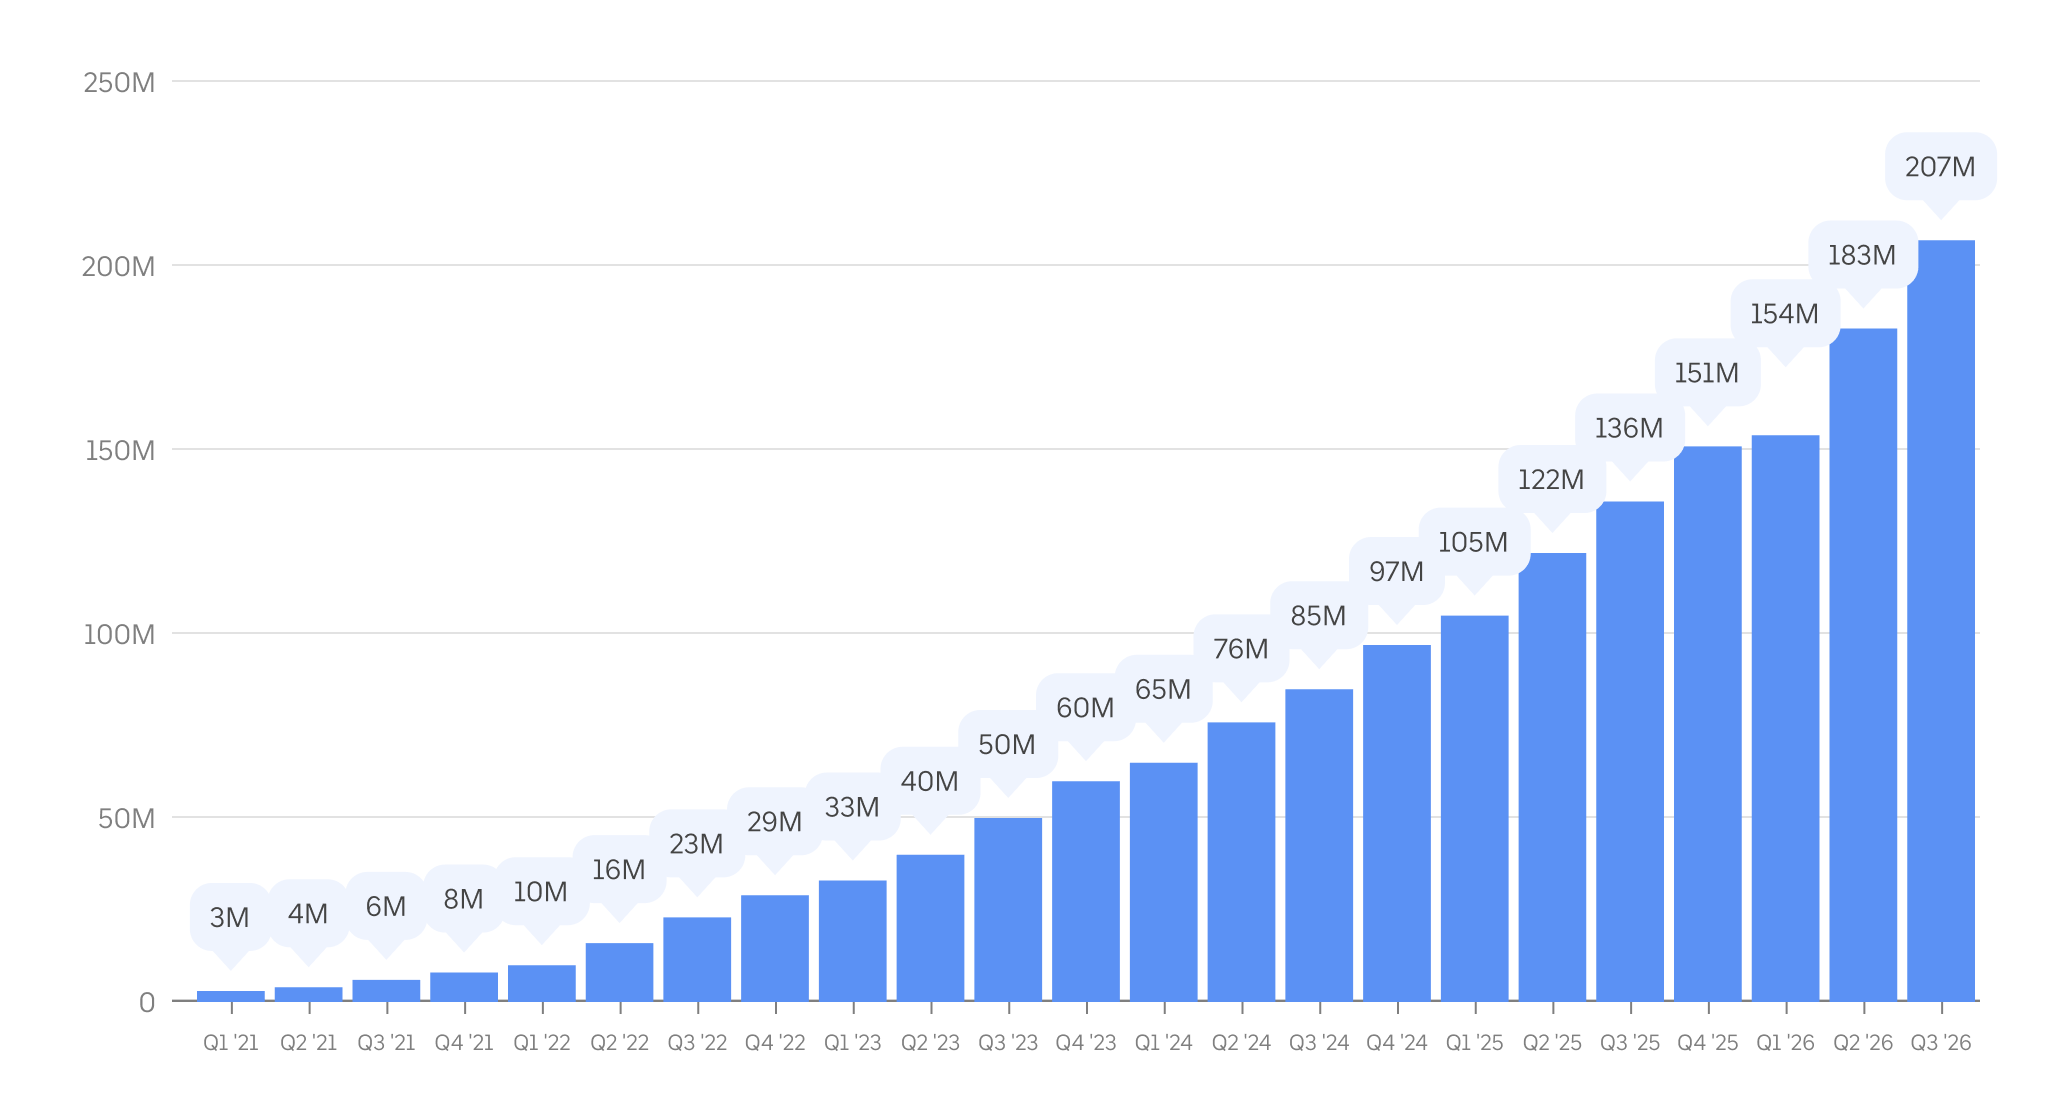
मीट्रिक:- 2021 की पहली तिमाही के बाद से, Uber ऐप पर व्यवस्थित की गई और जीइवी ड्राइवर पार्टनर द्वारा पूरी की गई ट्रिप की संख्या।
ZEV अपटेक
In Q3 2026, ZEV drivers completed 20.5% of all on-trip miles in Europe and 10.5% of all on-trip miles in the US and Canada. In select cities, such as Amsterdam and London, we're seeing ZEV miles of well over 40% on the platform. These figures reflect a ZEV adoption rate among Uber drivers many times higher than among the general public.
After ZEV mileage share declined in the US and Canada for the first time in Q4 2025, Q2 and Q3 2026 brought some of our largest quarterly increases across Canada, Europe, and the US.
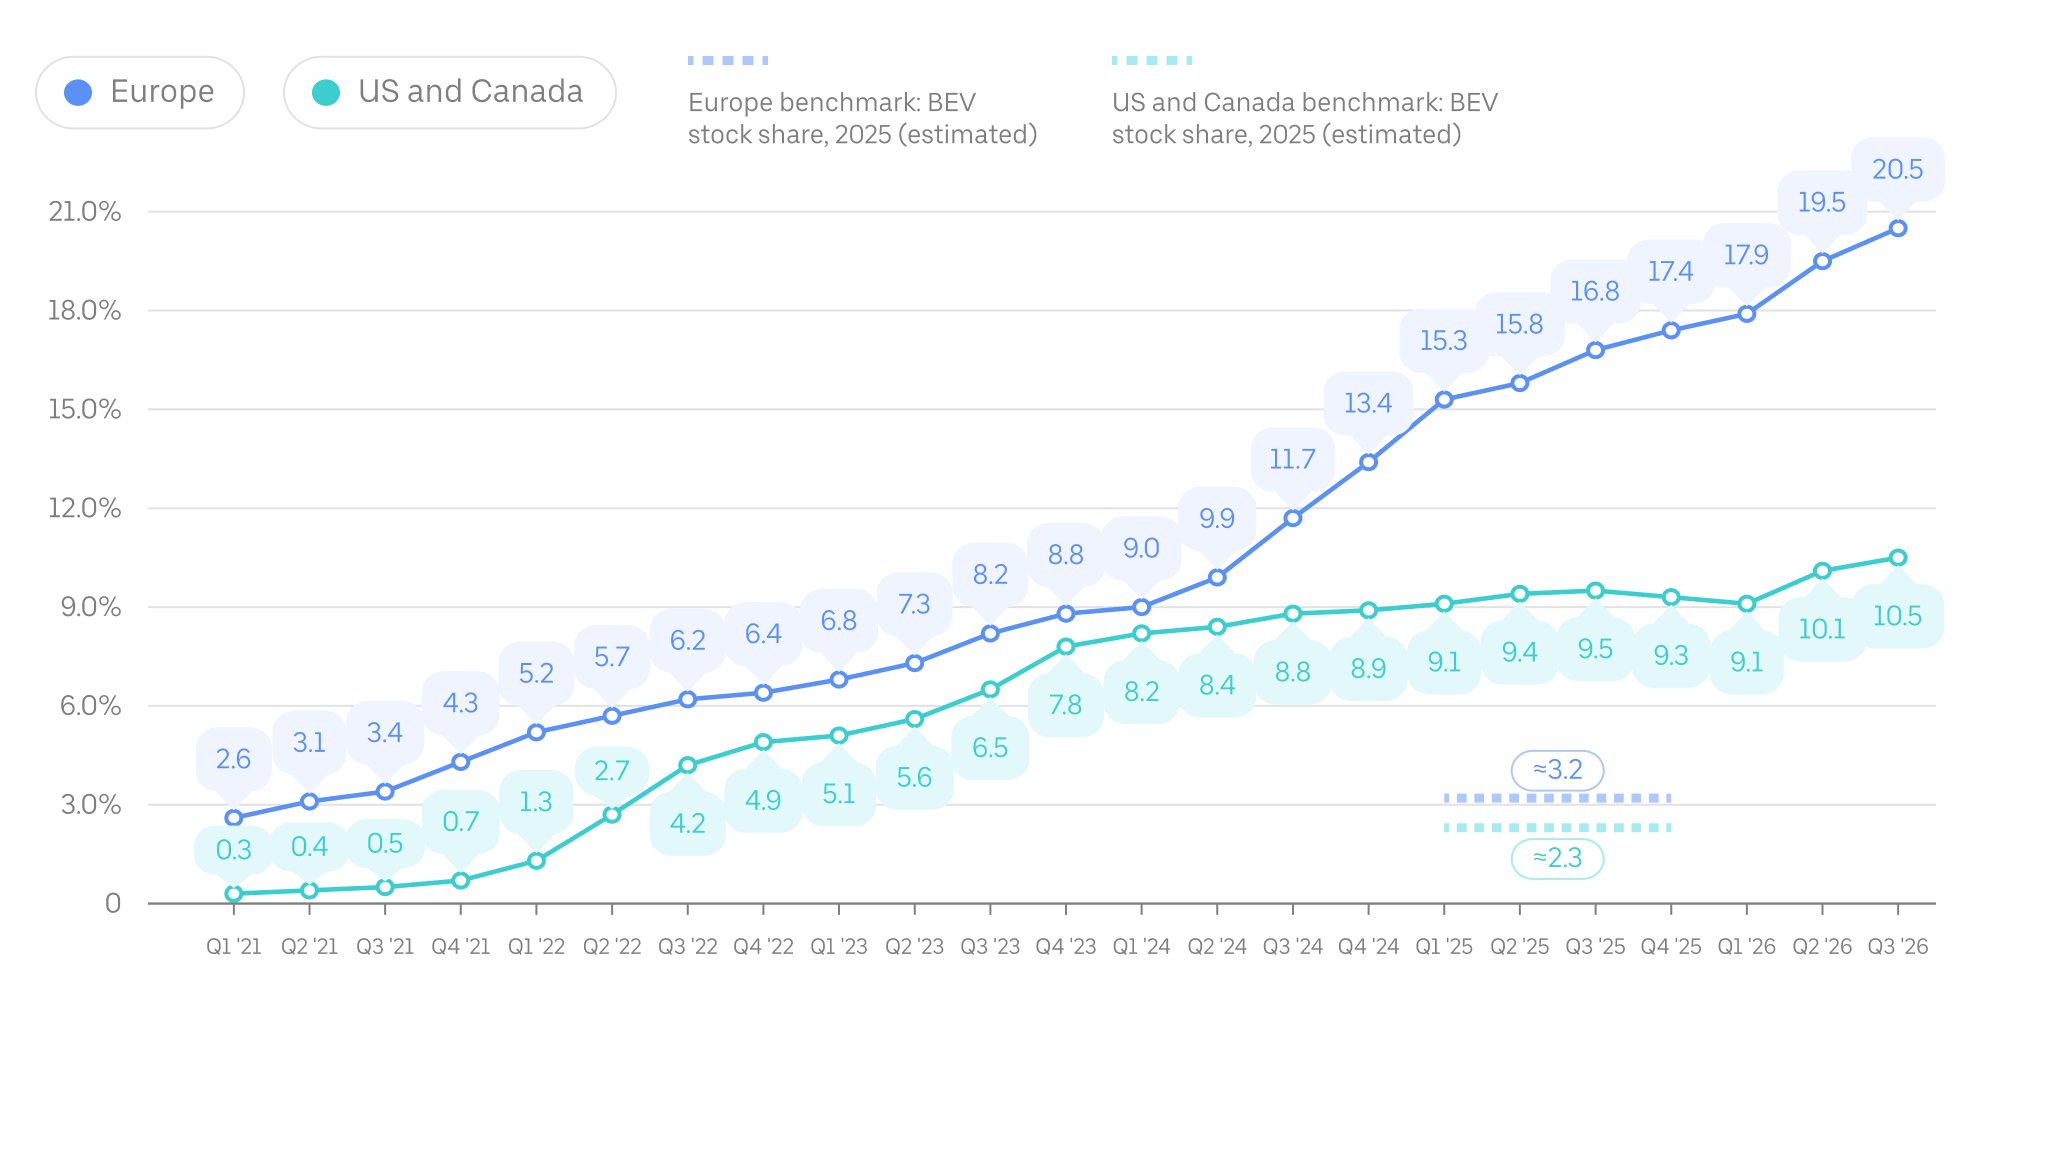
Metric: Share of on-trip miles completed in ZEVs compared with all on-trip miles arranged by the Uber app, by quarter since Q1 2021. Canada, US, and Europe benchmark data is as of 2025 (the most recently available at the time of this update) and is sourced from the International Energy Agency. “BEV” refers to battery electric vehicles.
The Europe region includes the following countries: Austria, Belgium, Czech Republic, Finland, France, Germany, Greece, Hungary, Ireland, Italy, Malta, Norway, Poland, Portugal, Romania, Slovakia, Spain, Sweden, Switzerland, the Netherlands, Turkey, and the United Kingdom.
प्रत्येक यात्री ने कितनी ट्रिप ली और उससे होने वाले प्रदूषण को मापना
2025 में, यूरोप में Uber पर एक यात्री द्वारा तय की गई प्रत्येक मील पर औसतन 186 ग्राम CO₂ (या प्रति किलोमीटर 116 ग्राम CO₂) का उत्सर्जन हुआ, जबकि अमेरिका और कनाडा में यह औसतन 318 ग्राम CO₂ (या प्रति किलोमीटर 199 ग्राम CO₂) था। 2021 की तुलना में, यह यात्री कार्बन तीव्रता मीट्रिक यूरोप में 19% और अमेरिका व कनाडा में 12% कम हुई।
कनाडा, यूरोप और अमेरिका में यात्री कार्बन तीव्रता 2024 और 2025 के बीच औसत यात्री संख्या में हल्की वृद्धि और बेड़े की ईंधन दक्षता बढ़ने के कारण कम हुई।
मेट्रिक :- यात्री कार्बन तीव्रता, या प्रति यात्री मील तय की गई CO₂ की अनुमानित ग्राम मात्रा, Uber द्वारा उपयोग किया जाने वाला एक वार्षिक दक्षता मेट्रिक है—और, तेजी से, दुनिया भर की सरकारें और कंपनियां इसका उपयोग कर रही हैं। राइडशेयरिंग या किसी भी ऑन-डिमांड मोबिलिटी सेवा के मामले में, किसी भी खाली मील (यात्रियों को लेने से पहले और रास्ते में वाहन द्वारा तय की गई दूरी) से उत्पन्न उत्सर्जन को गणना में शामिल किया जाता है।
हम यात्री कार्बन तीव्रता की गणना कैसे करते हैं, इस बारे में अधिक जानकारी के लिए हमारे कार्यप्रणाली दस्तावेज़ पर जाएँ। ध्यान दें कि यूरोप में Uber पर गाड़ियों की औसत ईंधन दक्षता अमेरिका और कनाडा की तुलना में काफी कम है, जिससे इन दोनों क्षेत्रों में कार्बन तीव्रता में अधिकांश अंतर स्पष्ट होता है। जबकि यूरोप में ड्राइवर पार्टनर द्वारा Uber ऐप पर इस्तेमाल की जाने वाली गाड़ियों की संरचना अधिक कुशल है (जहाँ ZEVs और हाइब्रिड्स का अनुपात अधिक है), वहीं अमेरिका में अधिक सख्त ईंधन दक्षता रिपोर्टिंग मानक भी इस अंतर का एक कारण हैं। इसके अलावा, हमारे पास 2021 से पहले यूरोपीय बाजारों में पूरी की गई यात्राओं के लिए यात्री कार्बन तीव्रता की गणना हेतु पर्याप्त इनपुट डेटा उपलब्ध नहीं है।
खास जानकारी और गहन जाँच
Uber: एक वैश्विक मार्केटप्लेस में इलेक्ट्रिफिकेशन (2026)
Uber 2026 में ईवी चार्जर निर्माण के लिए प्रोत्साहन देगा
Uber Electric (2025) का स्वागत करें
अमेरिका और कनाडा में इलेक्ट्रिक राइडहेल (2025)
सभी के लिए ईवी :- परिपक्व होने वाली तकनीक को संतुलित रूप से अपनाना (2024)
निरंतरता को बेहतर विकल्प बनाना (2024)
पूरे यूरोप में इलेक्ट्रिक मोबिलिटी को बढ़ावा देने में कैसे मदद करें (2024)
सही छोटे रस्ते चुन कर प्रदूषण से होने वाला नुसकान कम करें (2023)
कार्बन की तीव्रता के लिए मोबिलिटी मापना (2019)
अक्सर पूछे जाने वाले सवाल
Uber के विद्युतीकरण अपडेट में क्या है?
Our Electrification Update provides interested stakeholders with performance-based metrics on carbon-related emissions and electrification for passenger vehicle trips enabled by the Uber app.
आप यह अपडेट क्यों प्रकाशित कर रहे हैं?
हमारे मोबिलिटी प्लैटफ़ॉर्म के वास्तविक दुनिया में इस्तेमाल पर आधारित यह अपडेट हमारे विद्युतीकरण प्रभाव के बारे में ज़्यादा पारदर्शिता प्रदान करने में मदद करता है और हमारे प्लैटफ़ॉर्म पर दक्षता का समर्थन करने के हमारे प्रयासों को बेहतर बनाने में हमारी मदद करता है।
विद्युतीकरण अपडेट में आप किन मुख्य मापों का इस्तेमाल करते हैं?
मेट्रिक में यह चीज़ें शामिल हैं:-
- Uber पर ड्राइवर पार्टनर द्वारा जीइवी से आगे बढ़ना (जीइवी में पूरे किए गए ऑन-ट्रिप मील या किलोमीटर का हिस्सा), जो 2040 तक दुनिया भर में Uber पर 100% शून्य-प्रदूषण से होने वाले नुकसान मोबिलिटी के हमारे लक्ष्य की ओर हमारी प्रगति को मापता है
- प्रत्येक यात्री ने कितनी ट्रिप ली और उससे होने वाले प्रदूषण को मापना, जो प्रत्येक यात्री ने कितनी गाड़ी चलाई है उससे होने वाले प्रदूषण को मापता है
यह रिपोर्ट Uber पर राइड के लिए उत्सर्जन में कमी और विद्युतीकरण को कैसे बेहतर बनाएगी?
We have bold ambitions to reduce the passenger carbon intensity of trips and increase the use of zero-emission vehicles on Uber. Measurement and transparency of the progress are important steps along our journey.
क्या राइडर कम कार्बन वाले विकल्पों का इस्तेमाल करने के बजाय Uber से ट्रिप लेते हैं?
Rides with the Uber app are one of many transportation options available to people who are looking for a ride. Trip choice depends a lot on various local market conditions. Our analysis of US National Household Travel Survey data shows that a higher per-household utilization of public transit, walking, and biking correlates with a higher utilization of ridesharing and other on-demand solutions.
क्या आप दुनिया भर के अन्य देशों या क्षेत्रों के लिए समान डेटा मापेंगे?
Many of the above metrics now cover all passenger trips completed with the Uber app globally. We regularly report on carbon emissions and other impact areas resulting from trips on Uber.
आप Uber के विद्युतीकरण अपडेट को किस आवृत्ति के साथ देने की उम्मीद करते हैं?
हम कम से कम हर साल सभी मीट्रिक अपडेट करते हैं और हो सकता है कि कुछ मीट्रिक को ज़्यादा बार अपडेट किया जाए। हमारी योजना हर साल प्रदूषण से होने वाले नुकसान मीट्रिक (जैसे यात्री ने कितनी ट्रिप ली और उससे होने वाला प्रदूषण) जारी करने की है, जिसे कैलेंडर वर्ष के हिसाब से इकट्ठा किया जाएगा।
"ज़ीरो एमिशन व्हीकल" से आपका क्या तात्पर्य है?
हम “प्रदूषण ना करनेवाई गाड़ियाँ” (ZEV) शब्द का प्रयोग उसी प्रकार करते हैं जैसे कैलिफ़ोर्निया वायु संसाधन बोर्ड (CARB) और यूरोप के परिवहन एवं पर्यावरण (T&E) करते हैं: ऐसी गाड़ियों के लिए जो अपने विद्युत स्रोत से प्रत्यक्ष CO₂ उत्सर्जन या अन्य मानदंड वायु प्रदूषकों (जैसे NOx, कण पदार्थ, CO₂ और SOx) का उत्सर्जन नहीं करते हैं। क्षेत्रीय भिन्नताओं को पढ़नेवाले अपने विवेकानुसार ध्यान में रखें।
आज Uber ऐप का उपयोग करने वाले ड्राइवर पार्टनर दो प्रकार के जीईवी का उपयोग करते हैं: बैटरी इलेक्ट्रिक गाड़ी (बैटरी ईवी) और, बहुत ही कम बार, हाइड्रोजन-संचालित ईंधन सेल इलेक्ट्रिक गाड़ियाँ (FCEVs)।
बेशक, ZEV में "शून्य" का अर्थ गाड़ी के टेलपाइप से होने वाले किसी भी प्रदूषण का न होना है, न कि गाड़ी और उसके ऊर्जा स्रोत के उत्पादन से लेकर निपटान तक होने वाले सभी उत्सर्जनों का। हालांकि, सभी उत्सर्जनों को ध्यान में रखते हुए, स्वतंत्र विशेषज्ञों द्वारा किए गए जीवन-चक्र विश्लेषण से पता चलता है कि "आज पंजीकृत औसत मध्यम आकार की बैटरी इलेक्ट्रिक गाड़ियों का जीवनकाल में उत्सर्जन, यूरोप में तुलनीय गैसोलीन कारों की तुलना में 66%–69%, संयुक्त राज्य अमेरिका में 60%–68%, चीन में 37%–45% और भारत में 19%–34% कम है।"
क्या आप अपने डिलीवरी व्यवसाय के लिए प्रभाव का आकलन करेंगे?
Our Electrification Update currently covers electrification and emissions metrics only for our Mobility business (ridesharing). We aim to include our progress on delivery emissions and electrification in the future.
In terms of packaging, Uber continues to invest in helping merchants transition to recyclable, compostable, or reusable packaging options. As with electrification, however, progress depends on collective action. We’re prioritizing efforts in cities where public and private investments are aligned. For example, in France over 88% of packaging used on the platform is recyclable, reusable, or compostable, supported by national policy and local incentives.
While progress has been made, we have not been able to fully meet our goals for 2025, and our 2030 goals continue to be out of reach without stronger, coordinated action across government and industry.
While many key levers are outside our control, we remain deeply committed to this transition not just because it's the right thing to do, but also because it brings direct and strategic benefits to our business, our users, our cities, and our wider communities. To learn more about Uber’s approach to help reduce food delivery packaging waste with merchants, consult our Uber Eats for Merchants web page.
क्या Uber स्कोप 1, 2 और 3 प्रदूषण से होने वाले नुकसान के बारे में बताता है और अगर ऐसा है, तो वे कहाँ मिलेंगे?
Uber अपने गवर्नेंस स्ट्रैटेजी एंड एंगेजमेंट रिपोर्ट और CDP को स्कोप 1, 2 और 3 उत्सर्जन की जानकारी देता है। आप CDP के सार्वजनिक कॉर्पोरेट स्कोर खोज में हमारा नवीनतम स्कोर देख सकते हैं। इन उत्सर्जन अनुमानों को एक स्वतंत्र तृतीय पक्ष से सीमित आश्वासन प्राप्त हुआ है।
This page and the related information, updates, reports, and web pages (the “Report”) contain forward-looking statements regarding our future business expectations and goals, which involve risks and uncertainties. Actual results may differ materially from the results anticipated. Additionally, this Report is provided for informational purposes only and should not be relied upon for business or vehicle acquisition decisions. Undue reliance should not be placed on the forward-looking statements. We undertake no duty to update this information unless required by law. For more information on Uber’s strategy, please go to investor.uber.com.
Certain data disclosed in this Report has received limited assurance from LRQA. Data discrepancies with assurance may be present due to rounding methodologies.
The use of terms in this Report such as “drivers,” “couriers,” “earn,” “zero-emission vehicle,” and “zero-emission ride” are general and follow the general use case of the words by Uber Technologies, Inc. Regional variations of words should be considered at the reader’s discretion.
An overview of Uber’s use of carbon offsets can be found here.