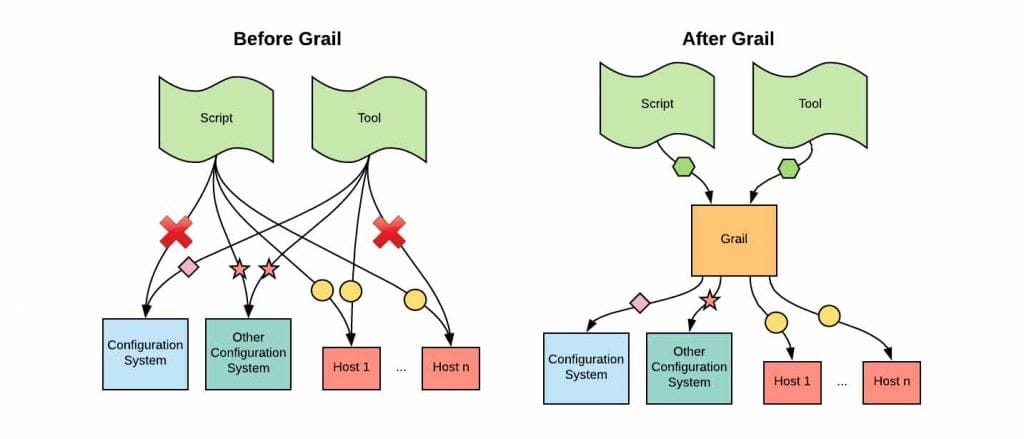
To build and maintain infrastructure at scale, easy access to the current state of the system is paramount. As Uber’s business continues to expand, our infrastructure has grown in size and complexity, making it more difficult to get all the information we need, when we need it.
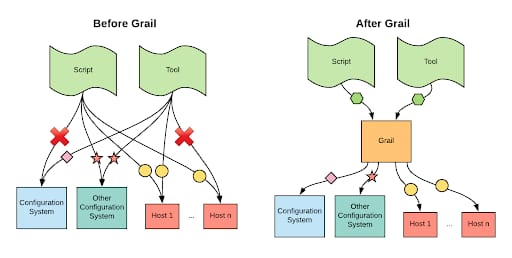
In order to solve this problem, we built Grail, a platform that enables us to aggregate the current state of our infrastructure into a single global view, spanning all zones and regions. Grail has made it easy for us to build tooling that quickly and robustly performs complex operational tasks.
Read on to learn how Grail fundamentally changed the way Uber Engineering operates its storage via a graph model that lets teams easily stitch together data from otherwise disparate sources.
Designing an easier way to manage
In late 2016, we upgraded all of our database hosts from spinning disks to SSDs to support increasing loads. An important part of this undertaking involved identifying and tracking the thousands of databases that still used our old hardware.
At the time, there was no easy way for us to access the current state, so this process involved a lot of scripting and task tracking. This drove us to look at different approaches for building operational tooling at scale. The requirements were:
- Continuous aggregation of the entire infrastructure state.
- A single global view of the infrastructure.
- Horizontally scalable read capacity.
- Low-latency access to the data from all data sources.
- Correlation of data across all data sources.
- Trivial addition and removal of data sources.
Finally, the data should be easily recreated from other sources. Today, Grail today supports all of these requirements.
Introducing Grail
Unlike Metricbeat, osquery, and similar information collection systems, Grail does not collect information for any specific domain, instead functioning as a platform where infrastructure concepts (hosts, databases, deployments, ownership, etc.) from different data sources can be aggregated, interlinked, and queried in a highly-available and responsive fashion. Grail effectively hides all the implementation details of our infrastructure.
Moreover, Grail lets you get near-real time answers to questions such as:
- Which hosts currently have more than 4TB of free space?
- How much storage disk space does a given team use across all their databases?
- Which databases are running on hosts with spinning disks?
These questions are trivial if you have a small number of services and hosts; in those situations, you just need to write a script that collects the state directly when it is needed. At Uber’s scale, however, when you have dozens of services and hundreds of thousands of hosts, this approach is no longer feasible. There are too many nodes, responses are slow, data correlation will be error-prone, and when your query is done, the results no longer reflect reality. Just-in-time state collection simply does not scale.
A key observation is that there is no “single source of truth.” The information about your data center and systems will invariably live in multiple places that need to be correlated to enable sound decision making. To further complicate things, the state of these systems are constantly changing: the free disk space of hosts changes all the time, new storage clusters are provisioned, and a million other things are happening in parallel. It is impossible to get the state of the entire system at once—you can only hope to approximate it.
Maintenance at scale
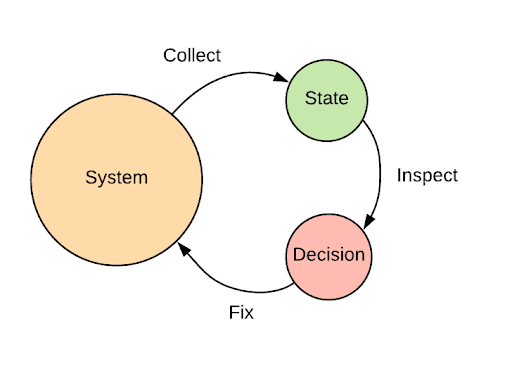
Uber’s Storage Platform team builds and maintains storage systems that hold petabytes of mission critical data. Our operational tooling follows a simple three step-process: first, we collect the system state, then compare it with the desired state, and finally act on discrepancies—a standard self-healing paradigm.
State collection at scale, as mentioned, is difficult without an aggregation platform like Grail. For example, when we want to get the current state for all hosts running, e.g. the trips datastore, we first need to figure out which hosts contain the datastore. Next, we have to connect to all of the hosts to collect the current state, and, finally, transform each result and present the answer.
With Grail, we can get access to the information we need by running a single query:
TRAVERSE datastore:trips (
SCAN cluster (
SCAN db (
SCAN host (
FIELD HostInfo
)
)
)
)
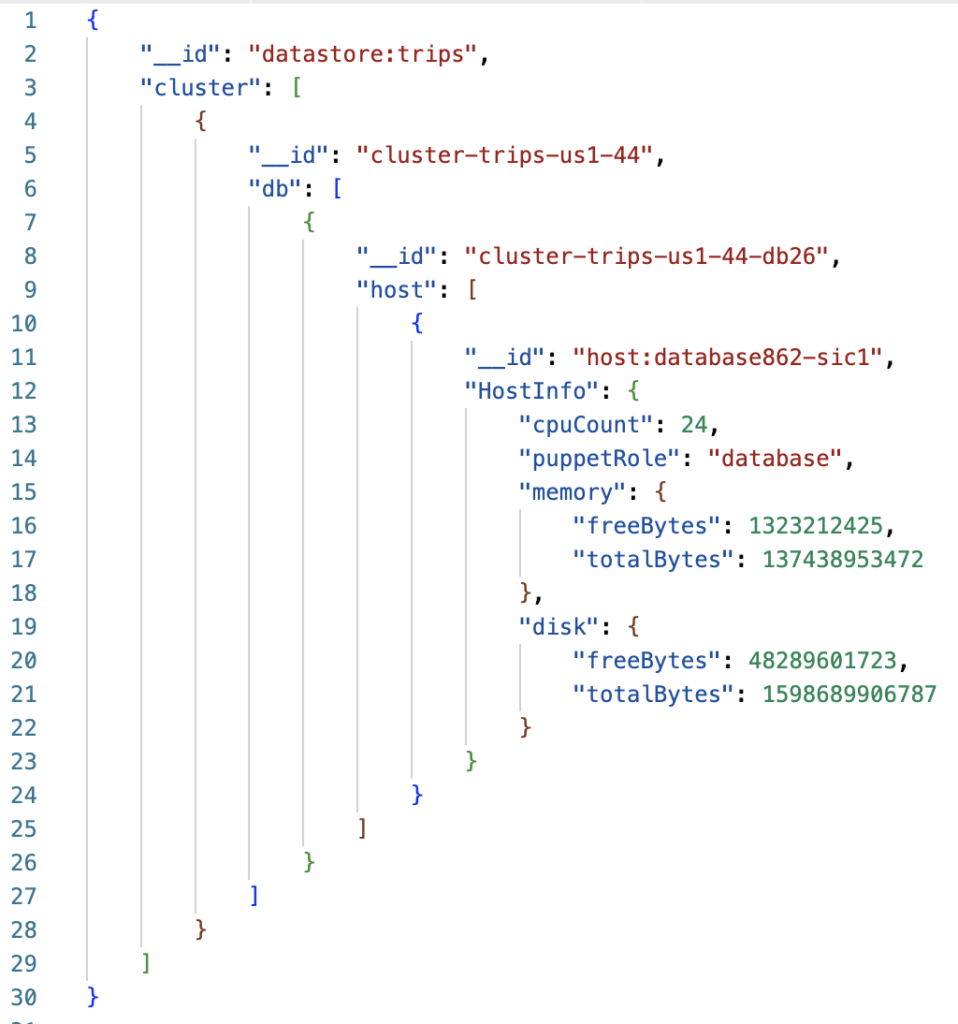
The result is returned as a JSON document that closely resembles the structure of the query, making it easily consumable by code. The snippet below shows a distilled version of how such a result would look when running the above example query:
Putting the puzzle together
Grail was designed around two observations about Uber’s infrastructure. The first observation was that our infrastructure could naturally be modeled as a graph of nodes and associations between nodes.
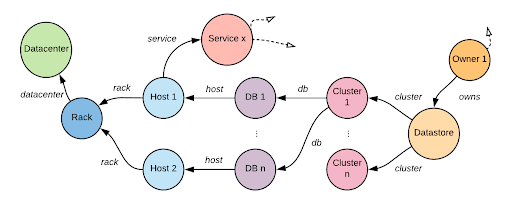
Nodes in the graph are identified by a unique key that combines a node type and name in the form type:name. Data sources attach data, which consists of both the properties and associations, to nodes using a node key. The data is likewise identified by a key. The node keyspace is global while the property and association keyspaces are local to the node type.
Grail’s object model is designed such that nodes in the graph are implicitly defined by the properties and associations produced by the data sources. This means node A exists when at least one of the following is true:
- A data source assigns a property of node A.
- A data source associates node A with at least one other node.
- A data source associates at least one other node with node A.
The second observation was that information about our individual infrastructure concepts, like a host or a database, is decentralized. This means that getting the full picture requires combining information from multiple systems.
Grail handles this decentralization by having each data source provide a subsection of the graph. These subsections can overlap in the sense that multiple data sources can attach properties or associations to the same nodes.
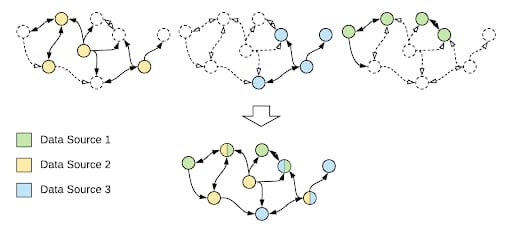
The top part of Figure 4, above, shows three such subsections. The solid lines and colors identify which subsections are supplied by which data sources, while the dotted lines indicate the combined graph. The combined graph below shows how the data is seen from the users of Grail’s perspective.
This approach allows us to update all data from a data source atomically, and for different data sources to update in parallel and at different rates.
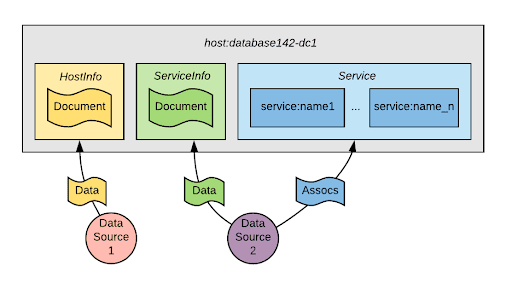
In figure 5, Data Source 1 attaches a property under the HostInfo key, while Data Source 2 attaches a property under the ServiceInfo key and associates the node with a range of other service nodes in the graph under the association type Service.
Navigating the data
With our design in place, we needed a way to easily perform ad-hoc graph traversals on the graph. None of the options we reviewed seemed to be a great fit. For instance, GraphQL requires schemas, and doesn’t support maps or named associations between nodes, while Gremlin seemed promising, but implementing support for it—let alone using it—is complicated. So, we wrote our own.
Our language, YQL, lets users specify a starting collection of nodes and then traverse the graph by following associations while interacting with the fields stored in the properties along the way. As an example, the following query lists all hosts with 40GB of free memory, 100GB of free disk space, and that use an SSD disk:
TRAVERSE host:* (
FIELD HostInfo
WHERE HostInfo.disk.media = “SSD“
WHERE HostInfo.disk.free > (100*1024^3)
WHERE HostInfo.memory.free > (40*1024^3)
)
The move to memory
Grail’s architecture has undergone several iterations since its inception. Originally, it was an internal component of our old database operations tooling. Written in Python, this first iteration used Redis for graph storage and was in part inspired by TAO. When this implementation became insufficient, we next decided to rewrite it in Go as its own service, using a shared Elasticsearch cluster for storage. Over time, however, this solution also lacked the scalability and latency we needed for fast, efficient ingestion and querying.
We decided to rethink the architecture, moving what was previously stored in shared ElasticSearch cluster into a custom-made in-memory datastore directly on each query node.
Grail’s current high-level architecture consists of three components:
- Ingesters: Collects data from the configured data sources.
- Coordination: Ensures strict ordering of data updates.
- Query Nodes: Provides horizontally scalable data access.
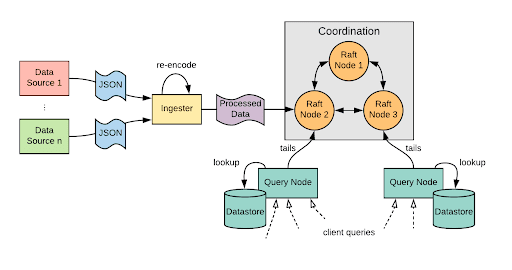
The ingesters periodically collect data from pre-configured data sources, which is then sent through a coordination cluster and finally applied to the datastore located on each query node. Coordination is done using a custom in-memory Raft cluster built on top of etcd’s Raft library. The Raft protocol ensures a strict ordering of how the data updates are applied to the datastores, as well as provides data durability across restarts. Both the coordination nodes and the query nodes contain an in-memory representation of the latest data updates for each data source. Coordination nodes only use this data as a means to create snapshots of current applied data when the raft-logs are truncated.
The datastore is a simple key/value-abstraction where each data source stores the latest data update under a unique key, name of the the data source. Data from all data sources are stored separately and only combined when performing node key lookups.
Grail enables a global view of our infrastructure by having a separate instance running in each of our regions; every instance is responsible for collecting data from the local hosts and services. The query nodes tail the raft-log from both the local and remote regions, depending on configuration. The query engine combines both local and remote information when executing queries.
To scale Grail, we can deploy multiple coordination clusters and extend the query engine with support for doing distributed queries, thereby allowing us to increase data throughput and size well into the future.
Dealing with accuracy
When interacting with distributed systems, it is important to account for information inaccuracy. No matter how the information is provided, whether through an aggregation platform or directly from the source, there will inevitably be some delay during which the observed system might have changed. Distributed systems are not transactional—you cannot capture it with a consistent snapshot. These conditions are true no matter the size of the infrastructure.
Our operational tooling uses the information provided by Grail to make decisions. When those decisions require changes to our systems, we always make sure to double-check the information at the source before applying those changes. As an example, when host-side agents are assigned tasks, the agent will check if the original preconditions still hold before executing the task, like gauging whether or not the host still has enough disk space.
Key takeaways
As discussed earlier, effective infrastructure management requires strong insights into the state of the system. When working with a smaller infrastructure, this is normally not that big of a problem; you simply query the source of truth when you need it. However, this approach simply does not work for larger scale systems. Instead, you need centralized information aggregation. As we learned firsthand, having quick access to a reasonably up-to-date system state when dealing with hundreds of thousands of hosts and dozens of systems of truth is quite powerful.
To this end, Grail’s strengths can be summarized in three key points
- Data from all of our sources of truth are aggregated into a single shared model with a common query API.
- Low-latency queries on current state from all zones and regions.
- Teams can attach their own domain-specific concepts and interlink them with related concepts from other domains.
Today, Grail powers most of our operational tooling for our storage solutions and there is an almost endless number of use cases for all aspects of our infrastructure. In fact, more use cases are being discovered as the extent of the contained information keeps growing.
If building self-healing operational tooling at scale with global impact interests you, consider applying for a role on our team!

Jesper Borlum
Jesper Borlum, Sr. Staff Engineer at Uber, is a seasoned software engineer, architect, and team player. He leads the Stateful Platform team, responsible for building the infrastructure to manage all of Uber’s stateful systems. The team’s mission is to deliver a fully self-healing platform without compromising availability, reliability, or cost. He’s currently leading the effort to adopt Arm at Uber.
Posted by Jesper Borlum


