Why Financial Planning is Exciting… At Least for a Data Scientist
For many, financial planning doesn’t seem like a very exciting career path, with its focus on number-crunching and accounting. Just try a search on accountant stereotypes and you will find many articles defending the profession, a sure sign that people in finance jobs feel misunderstood.
Count me on the side of the accountants, because, as a data scientist, I find financial planning at Uber incredibly exciting.
Financial Planning: a classic company exercise…
At Uber, like most companies, we plan our overall finances, including how to spend capital to grow our business, for the next year at the end of the current year. The goal of this planning is to set a smart budget and establish targets for key metrics such as gross bookings.
One element of financial planning involves deciding how much to spend on marketing in a given city and predicting the number of new users that should join our platform based on that budget. While the task of compiling numbers to make these predictions and determine this budget may seem boring, to a data scientist, it really involves a world of challenges, modeling, creativity, and excitement.
In a previous article, we explained that quantitative forecasting could be grouped into three categories: model-based, statistical, and machine learning-based approaches. The first approach, model-based forecasting, typically works well for financial planning as a whole. We know the underlying mechanism of our use case: encouraging new riders onto our platform creates demand, which means increased opportunity and earnings for our driver-partners. Likewise, having more drivers join our platform means quicker pick-up times for riders. We can create a model that shows how spending a certain amount on marketing for a city will encourage a specific number of new users.
However, if we break down our financial planning into smaller parts, we realize how we can also apply statistical methods and machine learning approaches to make predictions and solve problems. Looking at how these other approaches can be used requires imagination, and that’s what makes my role as a data scientist exciting.
… that opens infinite doors to data science modeling
Before jumping into an overview of the models we use for financial planning, let’s consider the problem given to data scientists. The basic question comes down to: where and how should Uber invest to serve the most users, including riders and driver-partners?
Now, what impresses me even more is that in 2018, Uber’s ride-sharing business operated in hundreds of cities, and millions of riders and drivers were active on Uber’s platform. That scale represents a truly exciting challenge!
Given the combined forces of this goal and our scale, we need to scope out our project. In Uber’s case, the Strategic Finance team defines the problem, and we must first align with our cross-functional partners, including regional heads of finance and city operations teams, on everything we need. For instance, these teams will tell us they need to know the numbers of new riders, new driver-partners, and trips we can expect depending on the marketing budget per city. We can portray this with a simplified schema, as shown in Figure 1, below. Using this flow, we can arrive at a figure for return on investment (ROI) by subtracting our upstream investments ($R and $D) from our gross bookings.

I want to emphasize that both the scale of the problem and the approach that we took, modeling with science metrics based on levers, pushes the envelope of financial planning in our industry. It is a true innovation and the complexity is increased by the fact that Uber’s business is a multi-sided marketplace where everything needs to be kept in balance.
As a data scientist at Uber, I also work with all stakeholders and partners, such as Big Data, back, and front-end engineers, and other data science teams, on financial planning. Not to go too deep into the details, but let me point out one number: during our 2019 financial planning, Uber’s data scientists used millions of historical data points to train their models.
Once each team is aligned, the real fun begins for a data scientist. Most of our job involves developing and implementing models to solve the given problem, and that is where you can really go deep with core data science skills.
Spend to sign-ups with Bayesian structural times series (BSTS)
The most upstream part of our flow (illustrated in Figure 1) models the number of driver/rider sign-ups (SUs) or, in other words, the number of users that register for the first time on the Uber app.
Displayed as a scatter plot in Figure 2, below, we can see examples of SUs given how much we spend on marketing. We observe that, usually, the more we spend, the more signups we get.

To understand how marketing spend affects SUs, we came up with a very refined model based on Bayesian structural time series notions. This model predicts SUs for each city based on marketing spend, holidays, and trend, with the following features:
- The impact of marketing spend follows diminishing returns.
- The model controls for trend.
- The model controls for holidays.
- Bayesian shrinkage is applied to get reasonable estimates for cities with thin data.
Beyond a simple polynomial interpolation, building this model requires econometric skills, making it very interesting for a data scientist.
Simple but efficient conversion model for first-time users
For sub-components of this project, simple, classical statistical models can be very useful.
In order to derive first-time users (FTs), riders who are taking their first trip, from SUs, we found that the most efficient model is a simple conversion curve. In the course of a week, the number of users taking their first trip with Uber is a fraction of people who sign up that same week, plus a fraction of people who signed up the previous week, plus fractions of people who signed up during each preceding week, illustrated by Figure 3, below:

Using this model, we customize the conversion curves for each city and allow the cohort conversion rates to change over time. This type of model accounts for cities with declining rider conversion over time, something we see in most U.S. cities with a mature user base. We also use a different time lag between sign-up and first trip for drivers and riders
We derive the gross booking (as depicted at the very end of the flow shown in Figure 1) from our trips data by considering fares per trip, service fees per trip, and other monetary components per trip as a set of univariate times series. In this instance, we apply classical statistical methods, which are sufficient to make rather strong predictions. Those methods take into account trend and seasonality (which excludes the family of basic smoothing techniques) without too much more work needed to refine them further.
Developing your own methodology
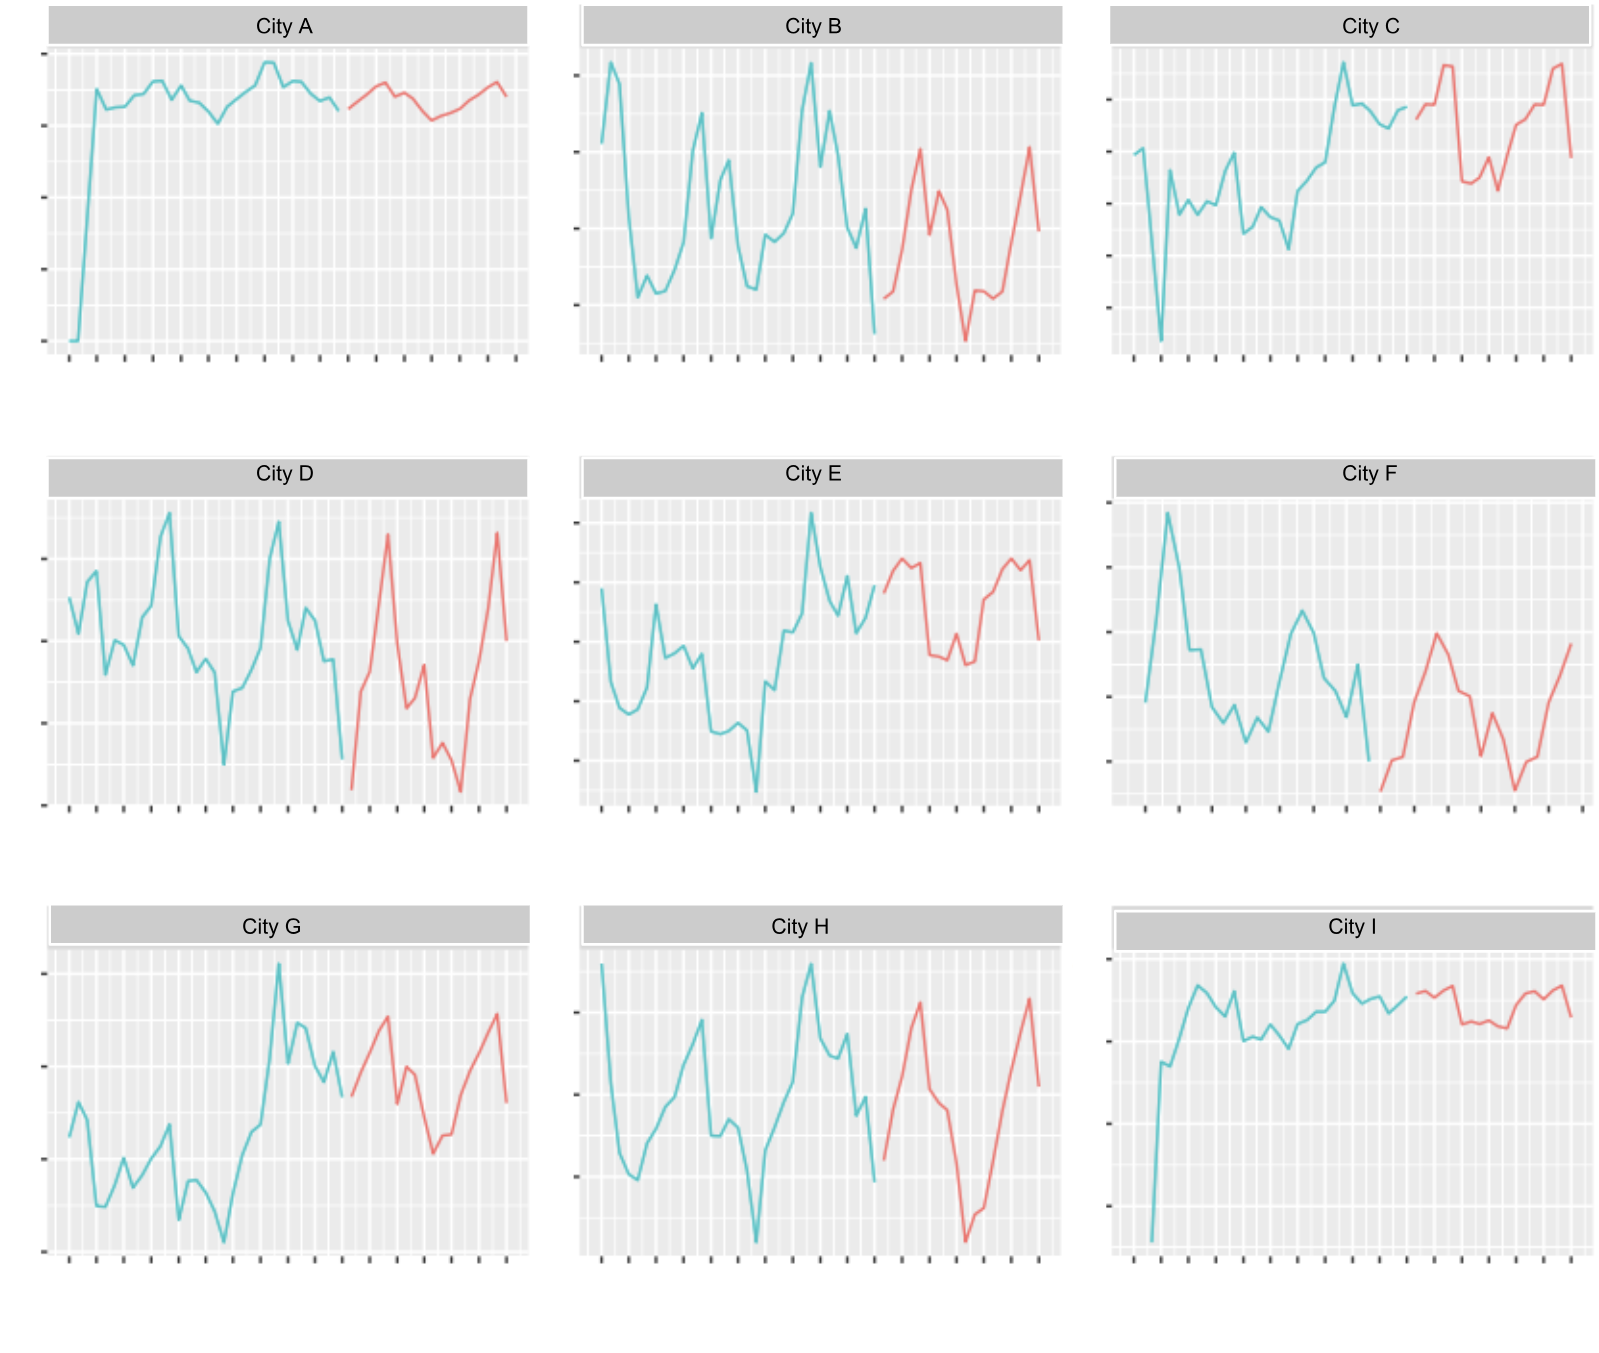
Referring back to our flow in Figure 1, the first-time riders/driver-partners (FTr, FTd) to trips portion, with active users as an intermediate output, is a bit tricky. How might we model this piece given the historical data shown in Figure 5, below?
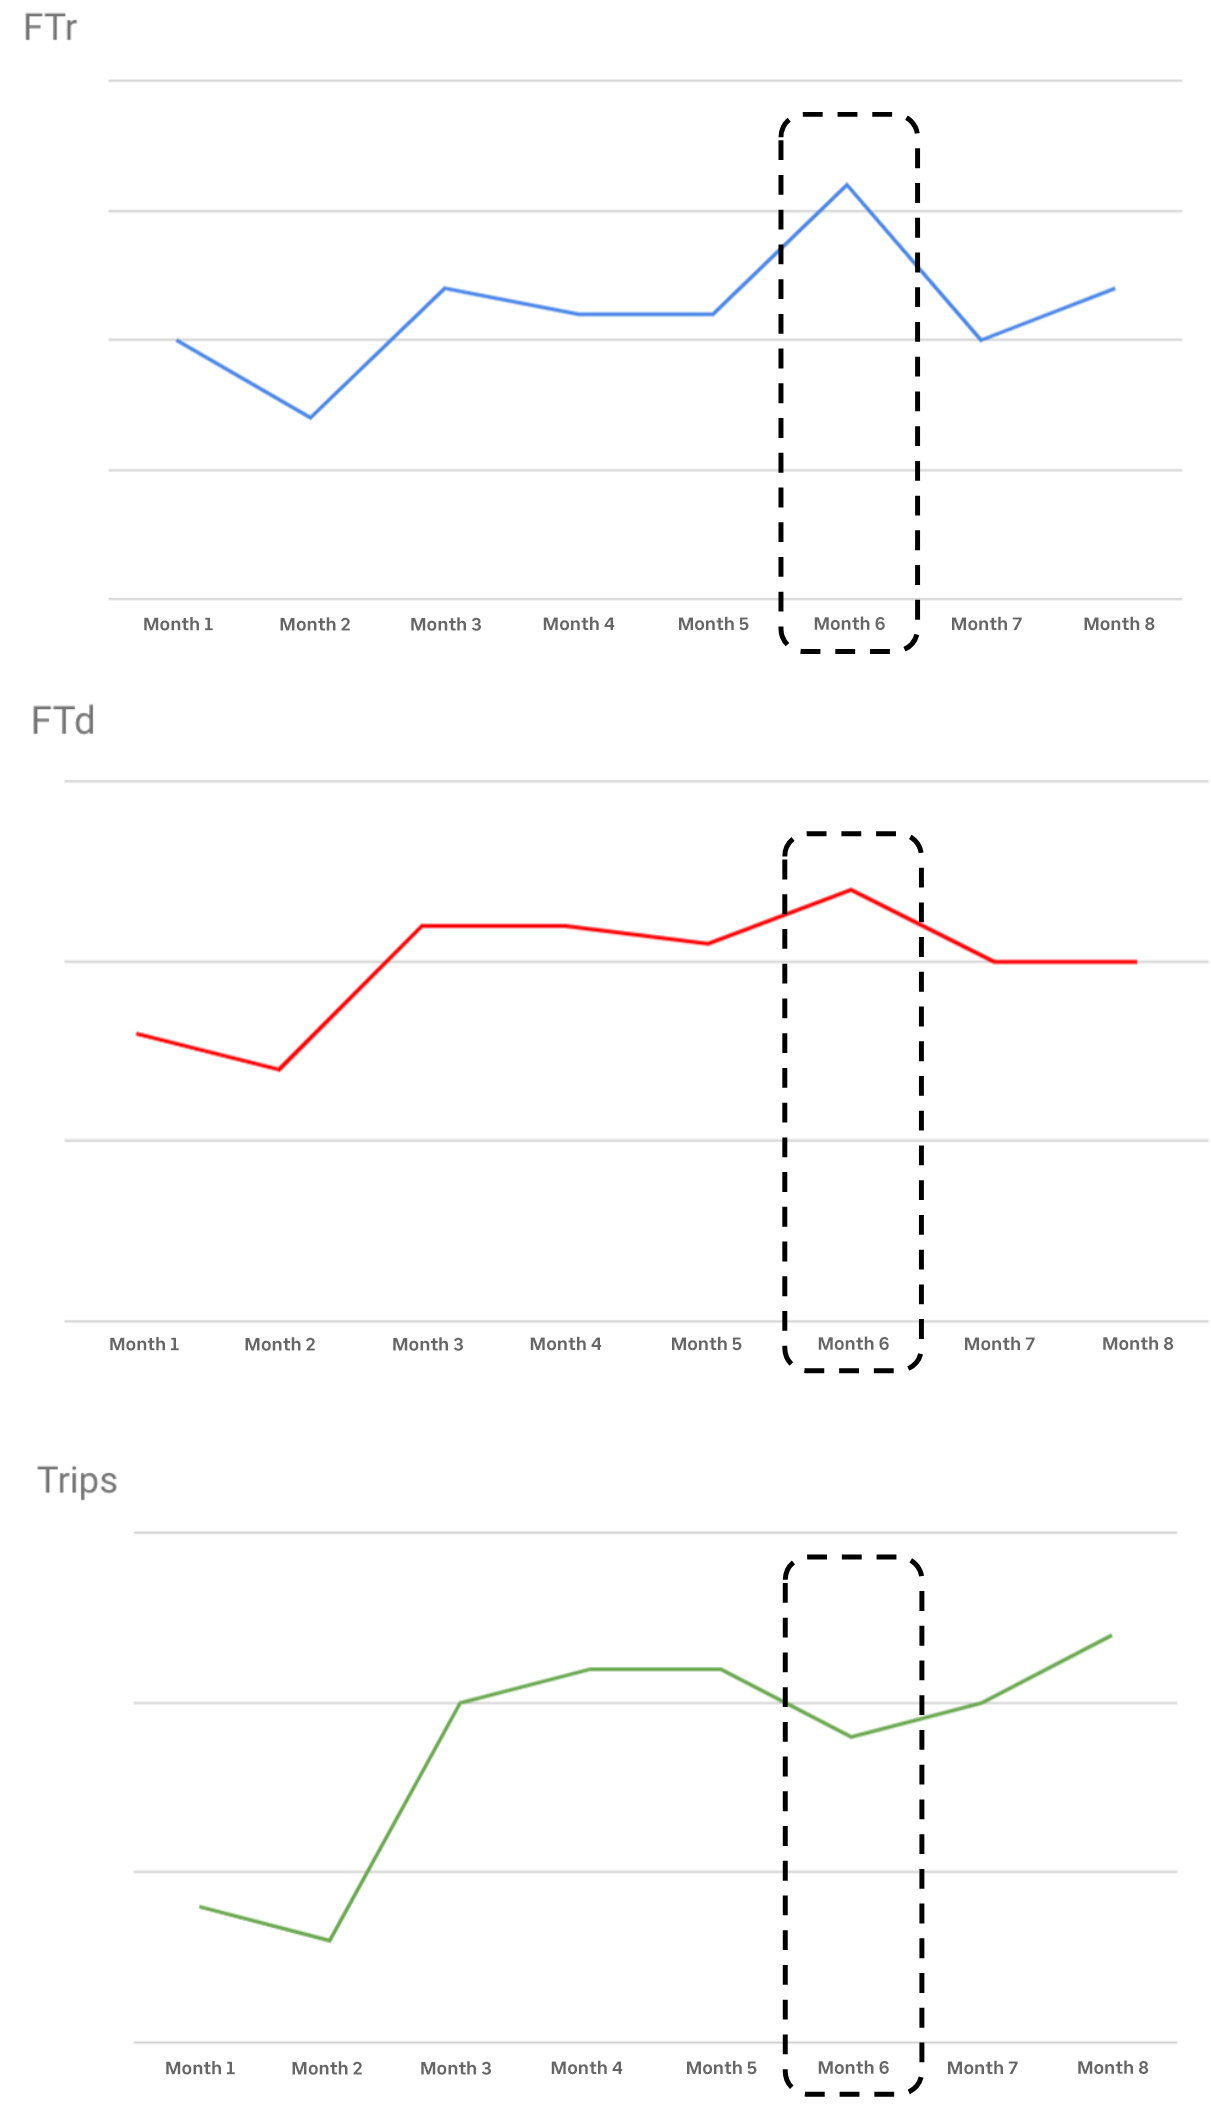
We can see, for instance, a negative correlation in Month 6 between FTs and trips: the former decreased compared to Month 5’s numbers, but the latter increased. If we used a simple statistical model that modeled and predicted trips using FTs as regressors or exogenous variables, like ARIMAX, the results would likely be inaccurate.
To understand why, let’s consider this simple example: in honor of a local holiday, Uber decides to temporarily spend more money on advertising in a specific city. However, a huge winter storm strikes, leading residents to limit their travel. While the advertising might lead to new sign-ups, do we see more people actually taking trips? Probably not. The weather may have a negative impact on the engagement of existing riders, decreasing the overall number of trips.
At the end of the day, the data shows that we increased our marketing spend, which led to an increase in FTs but to a stagnation or even a decrease in overall trips. A trip model with FTs as its exogenous variable calibrated on this data may then predict that an increase in FTs leads to fewer trips. That doesn’t sound good, right?
One obvious solution would be to incorporate a variable not taken into account in the model: the fact that the weather was extremely bad could be used as an exogenous variable. Unfortunately, severe weather is impossible to predict on the timescales we need for financial planning. Also, weather is just one example of an exogenous variable, and we would need to list them all if we wanted to use a model based on this principle, which is not possible.
Our solution was to build a model with a deeper understanding of business and econometrics metrics. We decomposed trips into three components reflecting the actual mechanism of how a trip is generated. In a given month we have:
- FTs, representing the number of first time users
- Actives/FTs, representing the number of active users (users who took at least one trip) divided by the number of first time users, a notion close to the retention of our users
- Trips/Actives, representing the number of trips divided by the number of active users, which is the average engagement of our users
And monthly trips are simply the multiplication of the three:

By modelling Actives/FTs and Trips/Actives, we end up with a model for trips that takes FTs as an input and that can also give Actives as an intermediate output. In practice, this equation is not that simple, and we made several attempts before successfully modeling it. For instance, can we model Actives/FTs and Trips/Actives independently? How do the models perform? We finally decided to consider cohorts of users defined by the month when they took their first trip, and built a cohorted model with the logic of trips decomposition in FTs, Actives/FTs, and Trips/Actives.

It is worth noting that Actives/FTs and Trips/Actives are not just random mathematical ratios, but are key metrics representing user retention in the former case and user engagement in the latter. These are valuable metrics for our business partners within Uber, and we are considering letting certain marketing investments modulate them.
My team built this trips model, which is tailored for our use case, from scratch. Creating it, including coding in R and then Python, was a real challenge but also great fun.
The importance of clear and concrete boundaries
Developing the models described above is just a taste of the forecasting techniques we use for financial planning at Uber. And the work does not end here; we also faced other challenges for which classic modeling alone was insufficient.
In collaboration with AI Labs, the Strategic Finance team is exploring new techniques to optimize financial planning at Uber. For instance, we have used a probabilistic approach to develop trip forecasts based on Gaussian processes techniques. We have also been developing a user-level model to capture the impact of incentives on our driver population. We are using a zero inflated Poisson distribution to model the probability of the number of trips per driver. We evaluate the parameters with Long Short-Term Memory Networks (LSTM) which is a special kind of Recurrent Neural Network (RNN).
My team is not the only one applying data science to concrete business problems at Uber. This philosophy, leveraging data science for intelligent decision making is part of Uber’s culture. We use it to ensure safety, improve customer experience, prevent fraud, and so much more.
Projects with clear scopes and boundaries–even those that seem daunting at first–let data scientists use the entire range of their talents and imagination to explore new techniques.
Interested in exploring how your data science skills can work to solve challenging problems? Apply for a role on our team!
Marianne Borzic Ducournau
Marianne Borzic Ducournau is a senior data scientist leading forecasting and optimization modelizations for Uber’s Financial Planning team.