Optimizing a dispatch system using an AI simulation framework
Written by
Bradley Voytek reporting on the latest science project we’re toying with: an AI simulation framework which examines thousands of driver/client interactions and behaviors within a city to optimize a city system.
Why are we doing this? At its core, Uber as a software platform currently has two main goals:
- On the rider side, getting you a ride when you need it.
- On the driver side, maximize trips taken on the system, which maximizes our driver partners’ earnings.
Optimizing these is the job for the Science Team — we want to maximize the chance of getting a ride right when you want one, all the while moving more people more places.
Fulfilling these goals requires modeling a number of complex, non-linear, interacting systems. This is difficult, to say the least, so what is a nerd to do? Have computers do the work for us!
We want to figure out how to optimize the dispatch radius, the farthest distance between a passenger and driver where we’ll allow a request to go through. This radius is different for each city, and it probably changes as a function of time as well. (Here’s the logic: During slow hours, drivers are willing to pick up a passenger who’s far away. If it’s super busy, drivers are less likely to accept trips with longer pickup times…since they figure they’ll get a closer request if they wait a few more minutes.)
Can we use this knowledge to generate plausible optimizations for Uber to explore? Indeed we can, by developing agents — simulated drivers and passengers — that behave according to a set of rules. Agent-based modeling allows us to see what combinations of parameters the simulations thought were best according to a predefined criteria. For the simplest case, we created an artificial city of 100-by-100 “blocks”. This simulation began with 250 passengers and 500 drivers randomly (Gaussian) distributed around this 10,000 square-block city. Each passenger has a random (uniform) destination.1
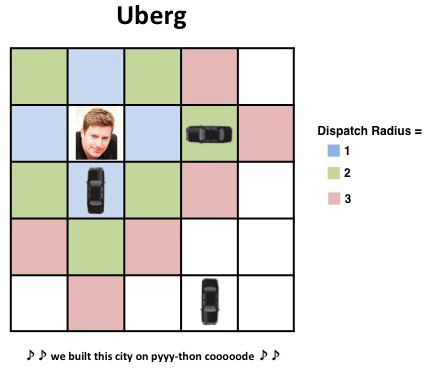
This is effectively a system with no central coordination. Each agent in the model (here, drivers and passengers) acts and interacts according to basic rules but is otherwise unaware of the other, unless engaged on a trip. As we increase the dispatch radius to 2 or 3 units, more cars are visible to accept the request.
So how do our agents behave?
- Each passenger is assigned a patience value, how long they’re willing to wait for a car before giving up. New passengers can also pop into the city.
- Drivers are simulated several ways. In one version, they don’t move unless they have a passenger. In another, they go for a random drive around the city. In a third version, drivers navigate back toward the “demand gravity” where the demand density is the greatest (essentially, the drivers know where the city hot spots are.)
Starting from these basic rules2 we run these simulations forward to see how outcomes differ as we manipulate any combination of parameters: dispatch distance3, user behavior, driver behavior (stationary, random drive, and gravity), etc. We ran each simulation for several hundred iterations and repeated 50 times to get an outcome variable error estimate (shown as error bars in the figures). The output variables of interest were:
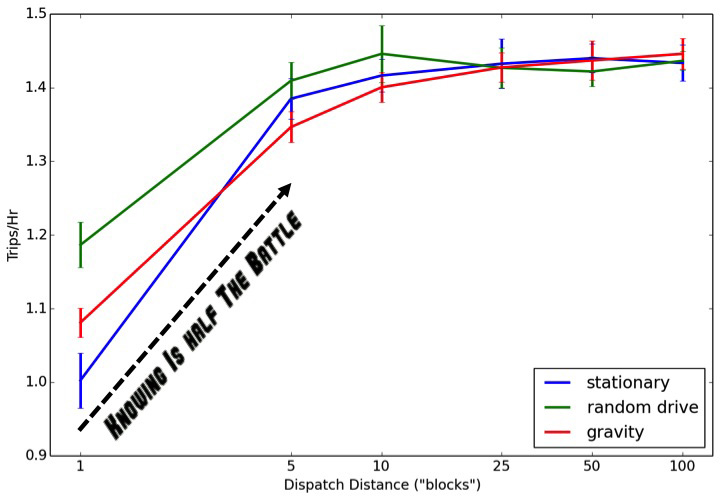
- Average # of trips completed
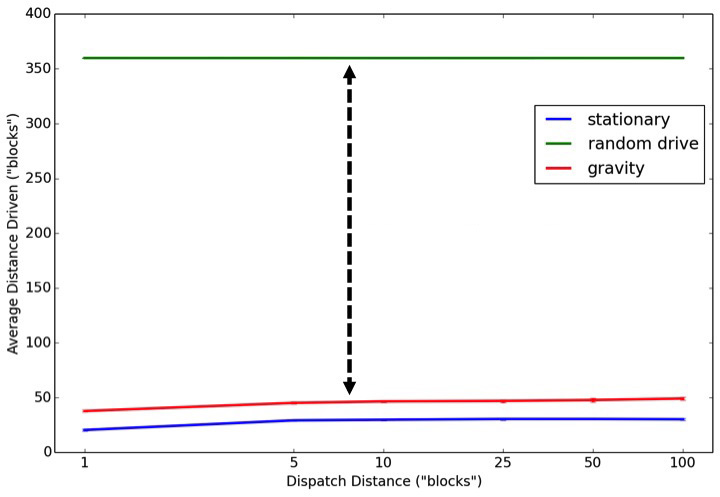
- Average distance driven (on and off trips)
- Average driver earnings
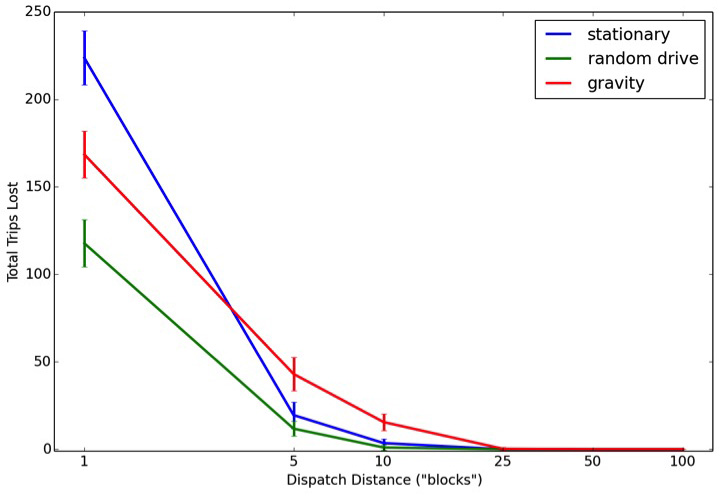
- Total potential trips lost
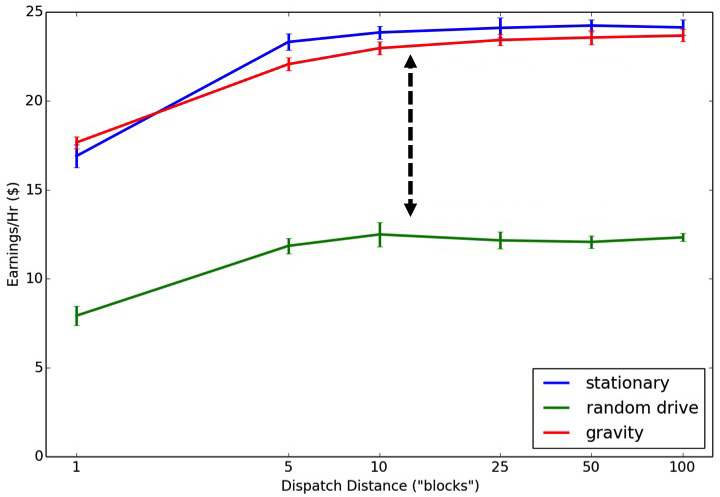
For the sake of simplicity, here we only show what happens as we manipulate driver behavior and dispatch radius. So, what do we find?
For a decentralized, taxi-like system — a dispatch radius of 1 — having drivers constantly moving (either randomly or drawn toward a population density) results in more completed trips per hour and fewer lost trips. However this advantage quickly disappears as the dispatch radius increases, such that drivers who remain totally stationary between trips perform just as well as drivers who are constantly on the move or gravitating back toward a demand-density.
This is important because without central dispatching, drivers who are constantly, randomly moving around a simulated city travel 10-20 times the distance compared to drivers who remain stationary or gravitate back toward a demand density between trips.
These simulations produce counterintuitive results. For example, you’d think that the optimal behavior for drivers (in terms of maximizing number of trips and total earnings while minimizing pickup times) would be to drop off their passenger and head back toward wherever demand is highest. But this is not always the case.
There are optimal dispatch distances for pairing a driver with a passenger, and there are optimal behaviors for drivers to take between trips. When dispatch distances are very short drivers should navigate back toward demand density. However when dispatch distances are relatively longer, drivers maximize their earnings by using less gas by remaining stationary between trips.
While we know that no real taxi drivers move randomly — they can rely on city knowledge to anticipate demand — Uber’s centralized, intelligent, real-time dispatching system removes any driver guesswork. Drivers working with Uber have access to real-time demand information and are less subject to randomness when searching for a passenger. This allows them to waste less gas and ultimately results in higher net earnings.
After adjusting for the cost of gas used during and between trips, simulated drivers following a random path between trips earn about half as much per hour as drivers with knowledge of demand locations. Drivers with access to intelligent, central dispatching earn 25-50% more than drivers who need to drive around looking for a passenger.
These simulations provide us with testable hypotheses against which we can run experiments and analyses to improve the Uber experience while simultaneously maximizing driver earnings…. all the while giving you an idea of the latest work that the Science Team is trying to tackle.
Footnotes
1 More sophisticated simulations don’t assume spatial or temporal distributions of passengers, drivers, or their destinations. Instead they randomly pull from the empirical distributions based on historical demand patterns. As we showed previously, we can easily quantify the network of pickup/destination links for a city. For example, the 100×100 grid can be abstracted as a digraph: each block is a node and edges represent the links between nodes where cars can validly move. These edges can then be weighted by the empirical drive times to further enhance the realism of the simulations.
2 More sophisticated modeling is based on swarm intelligence, used by research biologists to model flocks of birds, schools of fish, and even simulate orcs in the Lord of the Rings movies. (Seriously, read a Wired feature on the topic. It’s fascinating.)
3 A dispatch distance of 1 is functionally equivalent to a street-hail-only taxi system that requires the driver and passenger to be no more than 1 block away from each other. In contrast, increasing the dispatch radius is modeled such that the dispatching system locates the nearest driver and pairs them with the passenger making the request. The driver is then removed from dispatch, picks up the client, and is added back into the dispatching system once the client is dropped off.