Faster pickup times mean busier drivers
Director of Policy Research
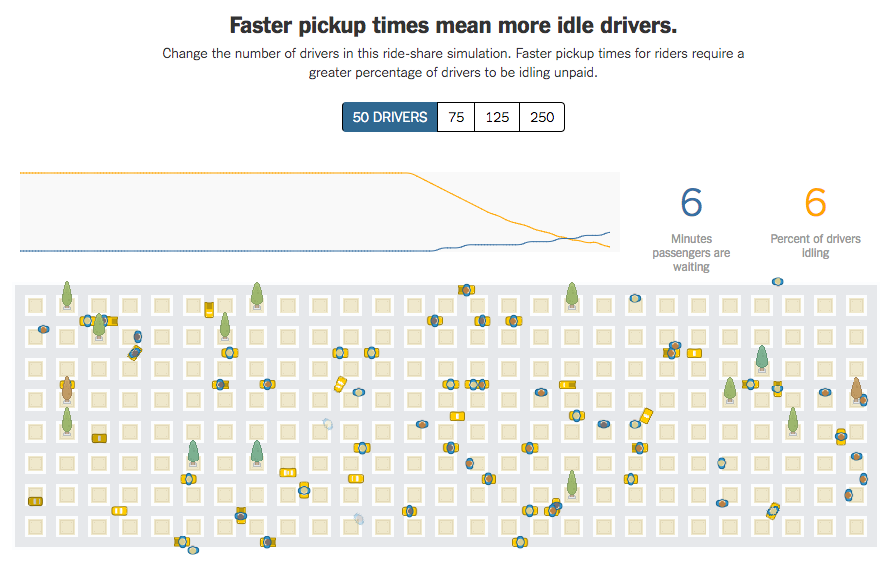
On Monday, the New York Times published an article with a simulation of a rideshare company that included the assertion that “faster pickup times for riders require a greater percentage of drivers to be idling unpaid”:
This is simply not true—and had the Times asked us whether it was, we would have explained the reality of what happens when Uber grows in a city: riders enjoy lower pick-up times and drivers benefit from less downtime between trips. It’s a virtuous cycle that is widely acknowledged in business and academia, and which is backed up by data.
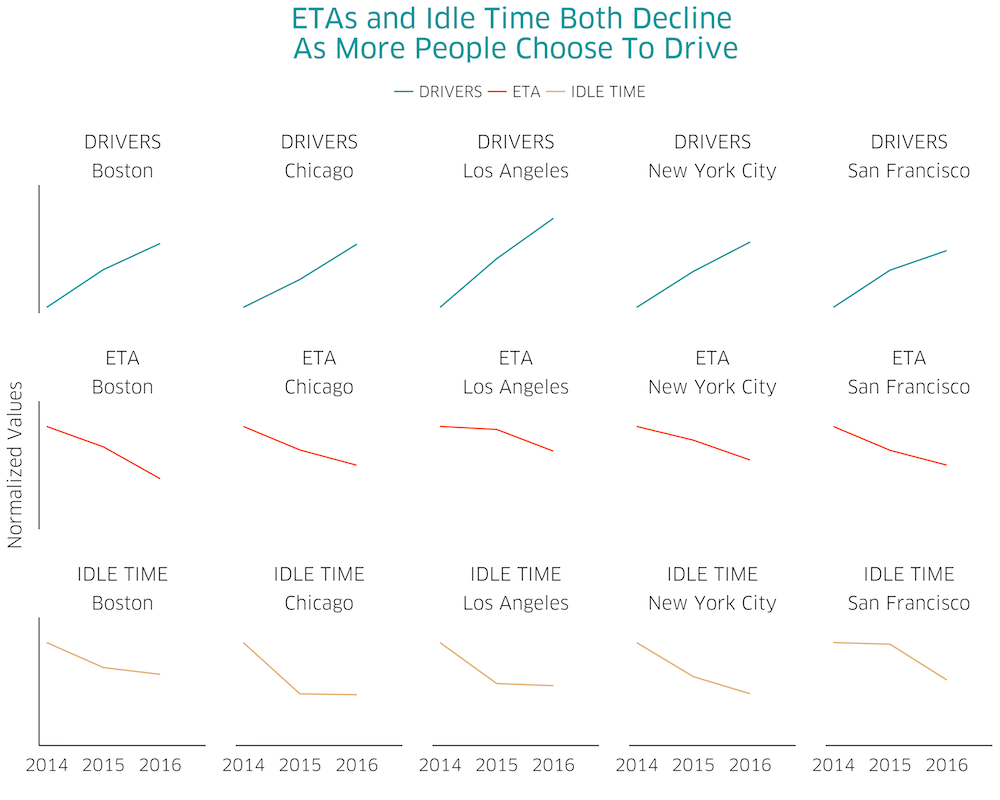
How is this happening? First, as the number of passengers and drivers using Uber grows, any individual driver is more likely to be close to a rider. This means shorter pickup times and more time spent with a paying passenger in the back of the car. In addition, new features like uberPOOL and Back-to-Back trips have meant longer trips, while incentives to drive during the busiest times and in the busiest locations help keep drivers earning for a greater share of their time online. And that should be no surprise: drivers are our customers just as much as riders. So although the Times article suggests that Uber’s interest is misaligned with drivers’, the opposite is true: it’s in our interest to ensure that drivers have a paying passenger as often as possible because they’re more likely to keep using our app to earn money. (And Uber doesn’t earn money until drivers do.)
Maximizing the efficiency of cars on the road also helps cities use existing infrastructure more efficiently, while minimizing congestion. Indeed, research from 2016 showed that Uber was already more efficient than pre-existing on-demand options, and we’re excited about those trends getting better over time.
So how did the Times graphic get it so wrong? While it’s hard to know for sure as its assumptions are not laid out transparently, it appears to suffer from at least two flaws:
- First, it appears to treat demand as fixed—in other words, there is a fixed quantity of riders in the simulation, no matter how good the service is. This cuts against a fundamental tenet of transportation economics: if you make a service more compelling and convenient, you attract more demand. Indeed, as our service quality has improved through lower wait times, we’ve seen the overall market grow. In some cities, Uber is now several times larger than the entire pre-existing taxi market.
- Second, and more importantly, the simulation assumes that the number of drivers on the road is both fixed and set by Uber. Neither is true: drivers choose to start or stop driving on a regular basis, and will only drive with Uber if and when it makes sense for them. If we were able to impose a situation where 80% of drivers’ time was idle, drivers would leave the platform in droves to work with competitors—or leave ridesharing altogether. This is not reflected in the graphic, where it appears an all-powerful hand can fix the quantity of drivers on the road at any one time. In fact, recent research has confirmed that one enormous economic benefit of Uber to drivers is the value of schedule flexibility.
So what does it all mean? Happily, evidence to date has shown that all three things can happen simultaneously: we can grow the overall number of people who have access to work with Uber while reducing wait times for riders and reducing the amount of time drivers spend idling. That’s an exciting set of evidence for the future of on-demand transportation.