Uberi elektrifitseerimise uuendus
Q3 2025 update: This page includes metrics for trips completed on Uber by internal combustion engine vehicles and zero-emission vehicles (ZEVs, such as battery EVs) from the beginning of the first quarter of 2021 to the end of the third quarter of 2025. Note that the scope of this report includes only Uber’s Mobility business (ridesharing).
Jälgime oma teekonda heitkoguste vähendamiseni
Five years into our ambitious efforts to transition to a zero-emission platform, we’ve made meaningful progress. Today, Uber is the world's most widely available platform for zero-emission rides, with drivers adopting EVs (electric vehicles) up to 5 times faster than average motorists in the US, Canada, and Europe.
We’ve invested hundreds of millions of dollars to help interested drivers make the switch to electric through incentives, partnerships, and product enhancements—and it’s paying off. Increasingly, riders are experiencing their first EV on Uber, helping to normalize and accelerate the adoption of electric transport all over the world.
Our data shows that EV progress quickens when government and industry work together to get the economics right. In cities like London, Vancouver, and Amsterdam, where thoughtful policies, industry investment, and strong charging networks align, more than 1 in every 3 miles on Uber are now electric.
Despite this significant progress, major barriers remain to fully achieving our goals. High upfront EV costs, limited charging access, and inconsistent policy support continue to slow adoption. Based on current trends, we cannot meet our remaining mobility and delivery goals for 2025, and our 2030 goals will be out of reach without stronger, coordinated action across government and industry.
As we’ve said from the start: Climate is a team sport, and progress depends on collective action. That’s why we’re increasingly prioritizing efforts in cities where public and private investment are aligned.
While many key levers are outside our control, we remain deeply committed to this transition—not just because it’s the right thing to do, but also because it brings direct and strategic business benefits. Thousands of drivers around the world are taking home more money thanks to lower EV operating costs and rider demand for electric vehicles. Riders report higher satisfaction with the EV experience and are increasingly choosing EVs.
And finally, the future is shared, electric, and autonomous—and the coming wave of autonomous (electric) vehicles will create a major tailwind in achieving our sustainability goals.
Our latest update below outlines the progress to date, key insights, and areas of focus for 2025 and beyond.
Nullheitega sõidukite (ZEV) juhid
Globally, more than 286,000 ZEV drivers were active on Uber’s app in Q3 2025. That’s over 57% more than the same period a year earlier.
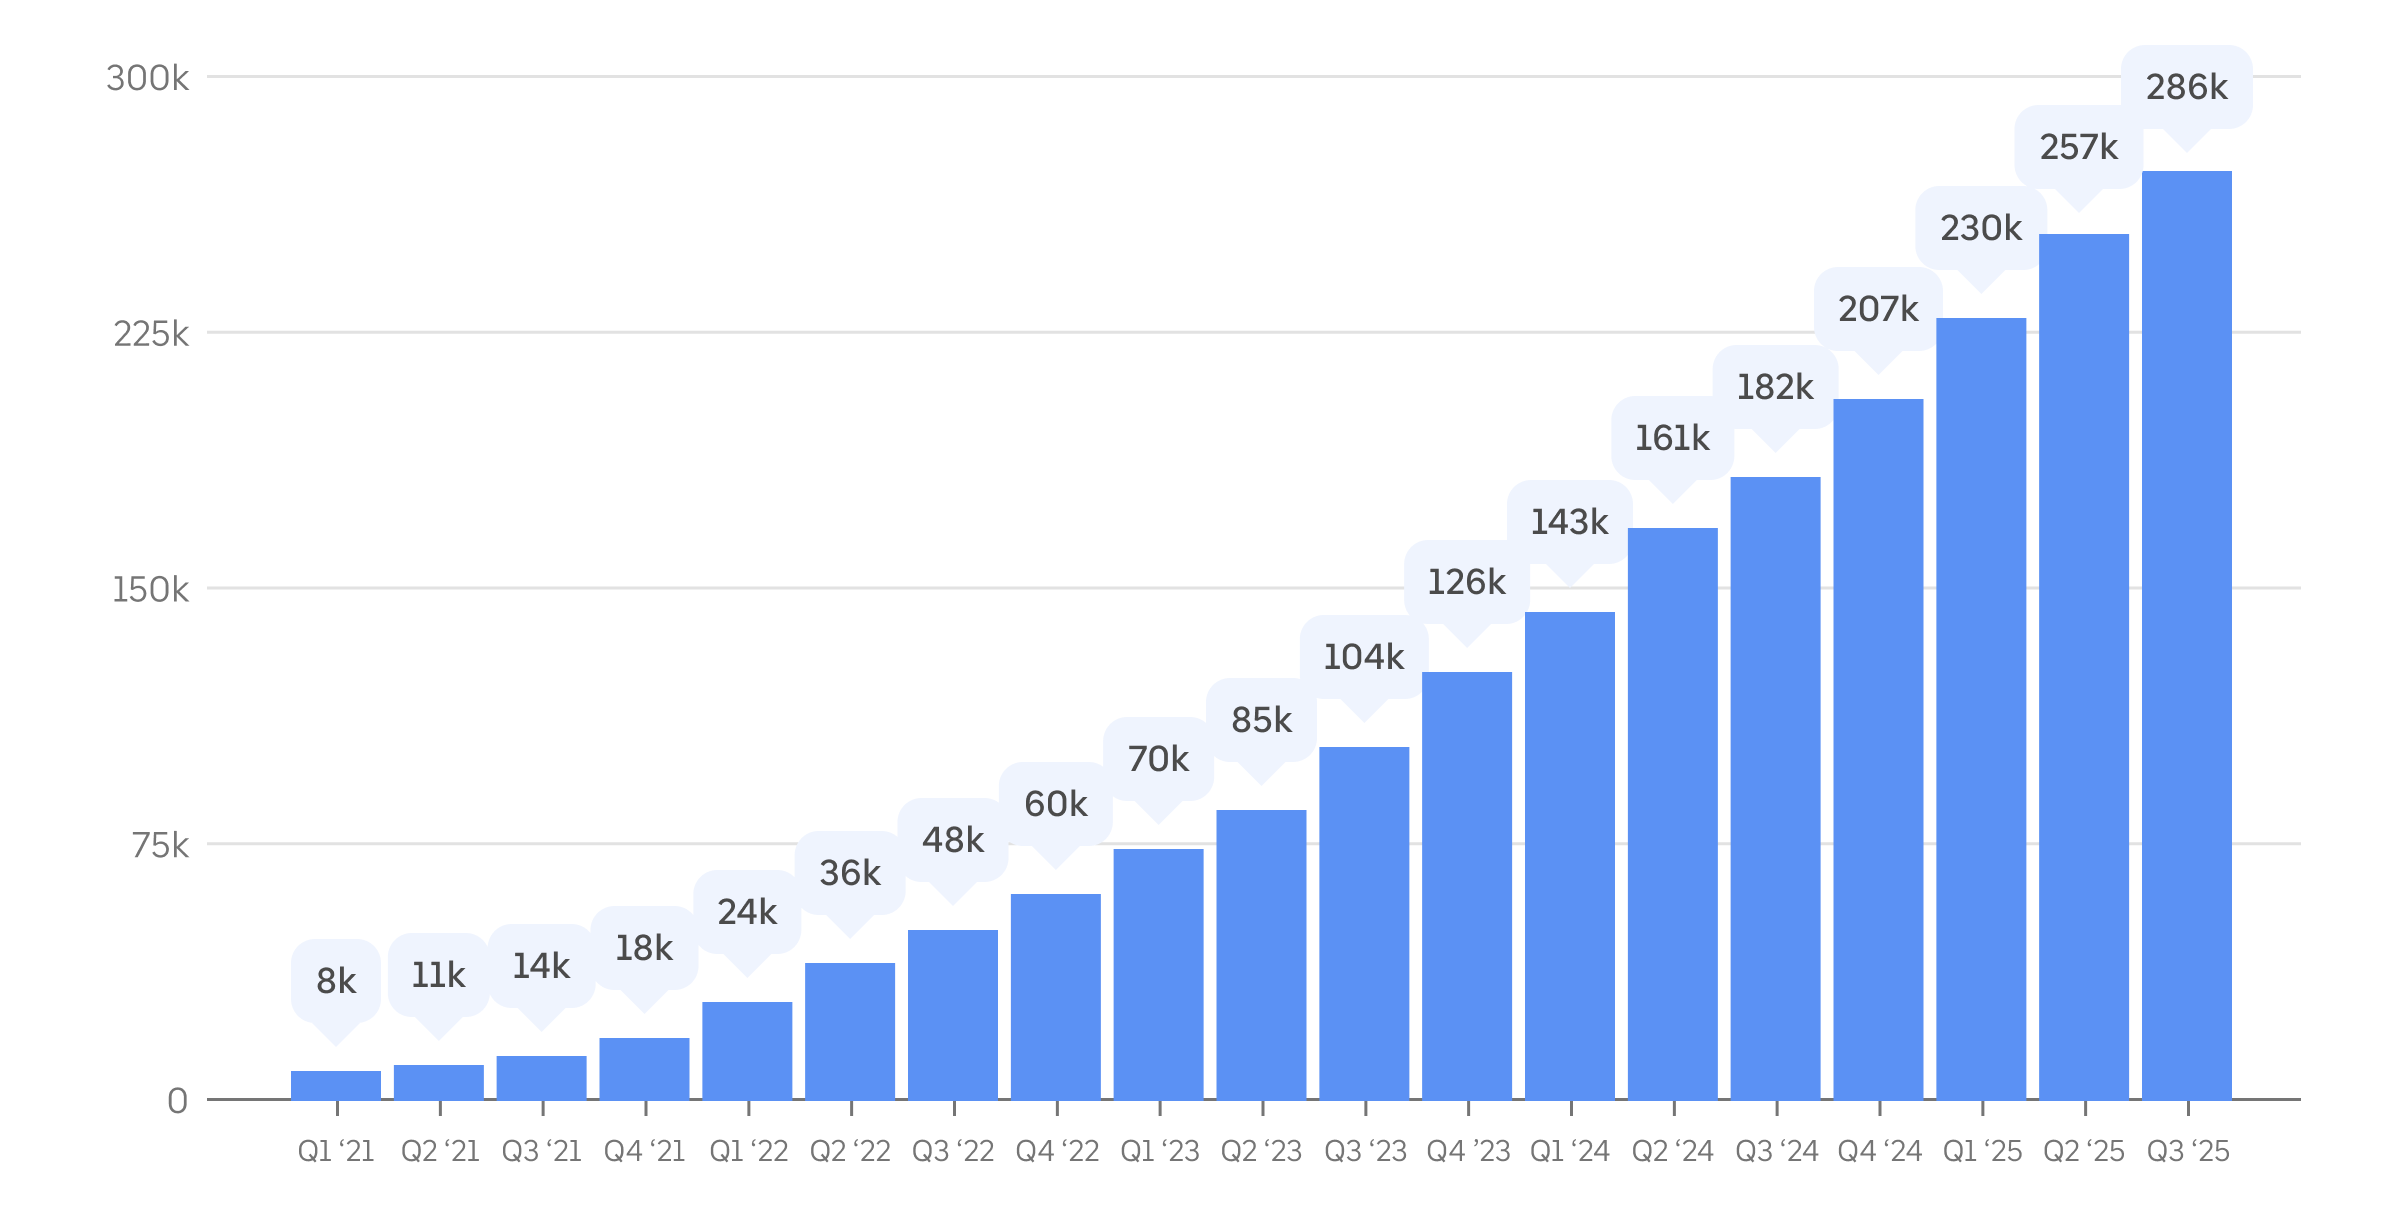
Mõõdikud: Keskmine igakuine aktiivsete ZEV-juhtide arv Uberis kvartalite kaupa, alates 2021. aasta esimesest kvartalist. Uberi rakendust kasutavad juhid loetakse antud kuul aktiivseteks, kui nad on sellel kalendrikuul teinud vähemalt ühe sõidu.
ZEV-sõidud
In Q3 2025, ZEV drivers completed over 136 million trips using Uber, globally. That’s more than 17 ZEV trips on Uber every second, on average. The Q3 2025 total is 60% more than the number of ZEV trips completed on Uber during the same period a year earlier.
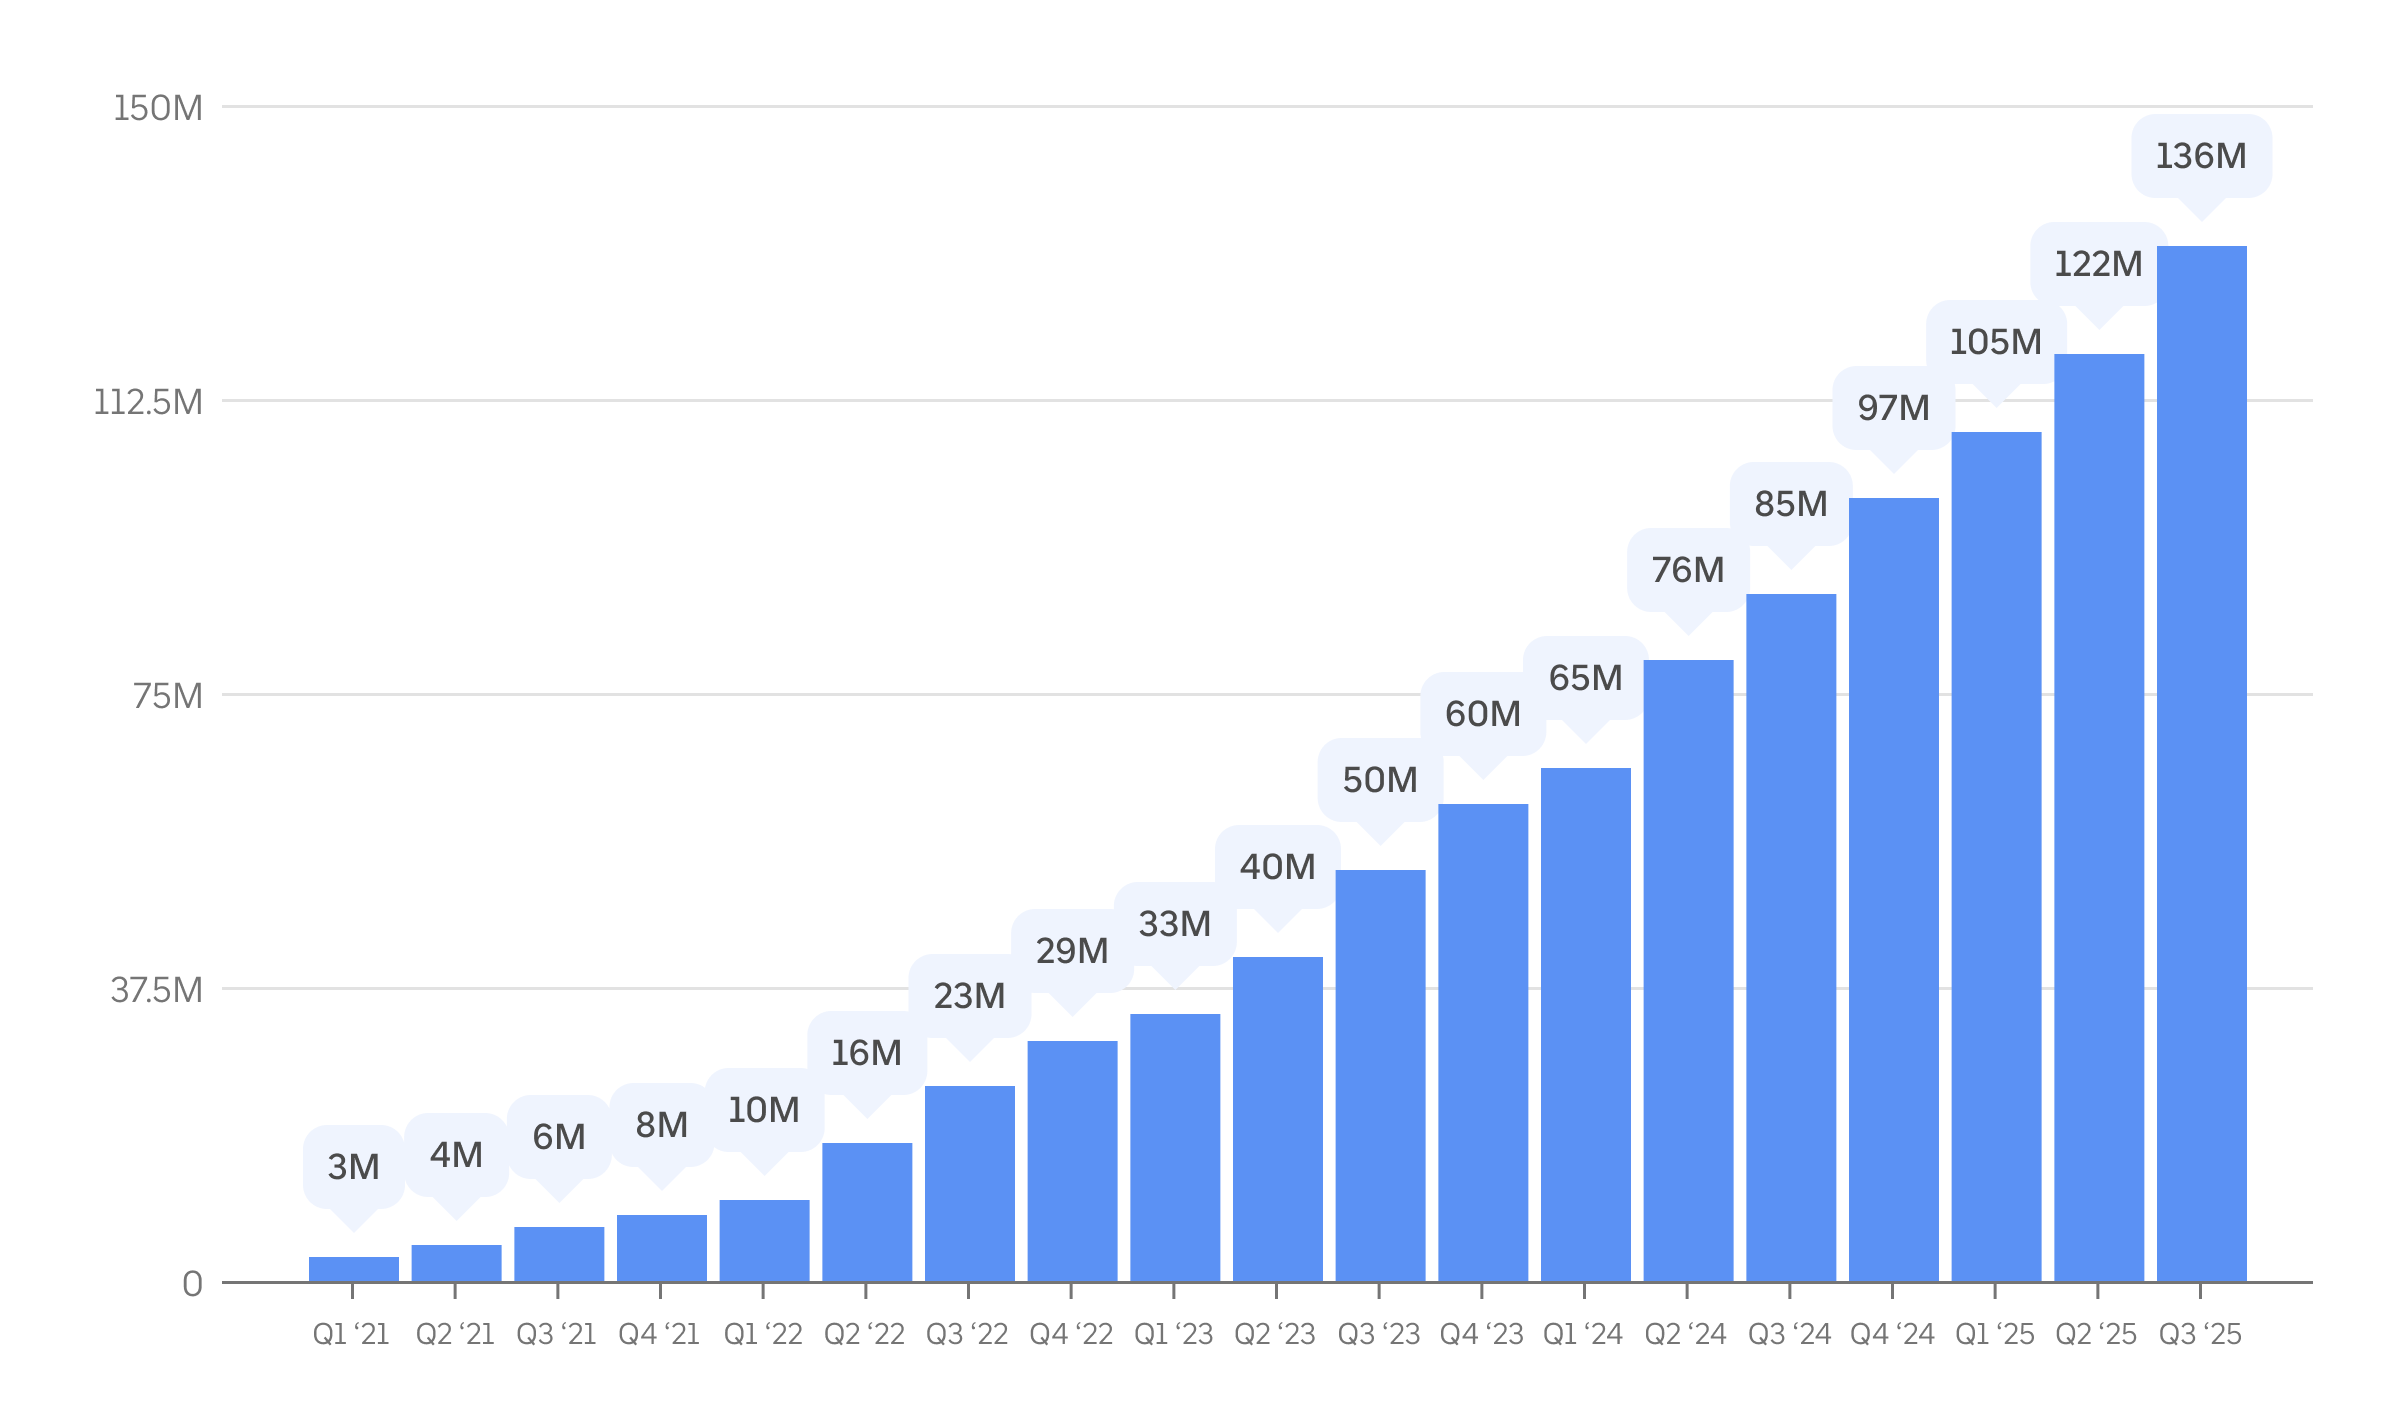
Mõõdikud: Uberi rakenduses korraldatud sõitude arv, mille ZEV juhid on sooritanud, kvartali lõikes alates 2021. aasta esimesest kvartalist.
ZEV-i kasutusele võtmine
In Q3 2025, ZEV drivers completed 16.8% of all on-trip miles in Europe and 9.5% of all on-trip miles in Canada and the US—adoption levels many times above drivers in the general public.
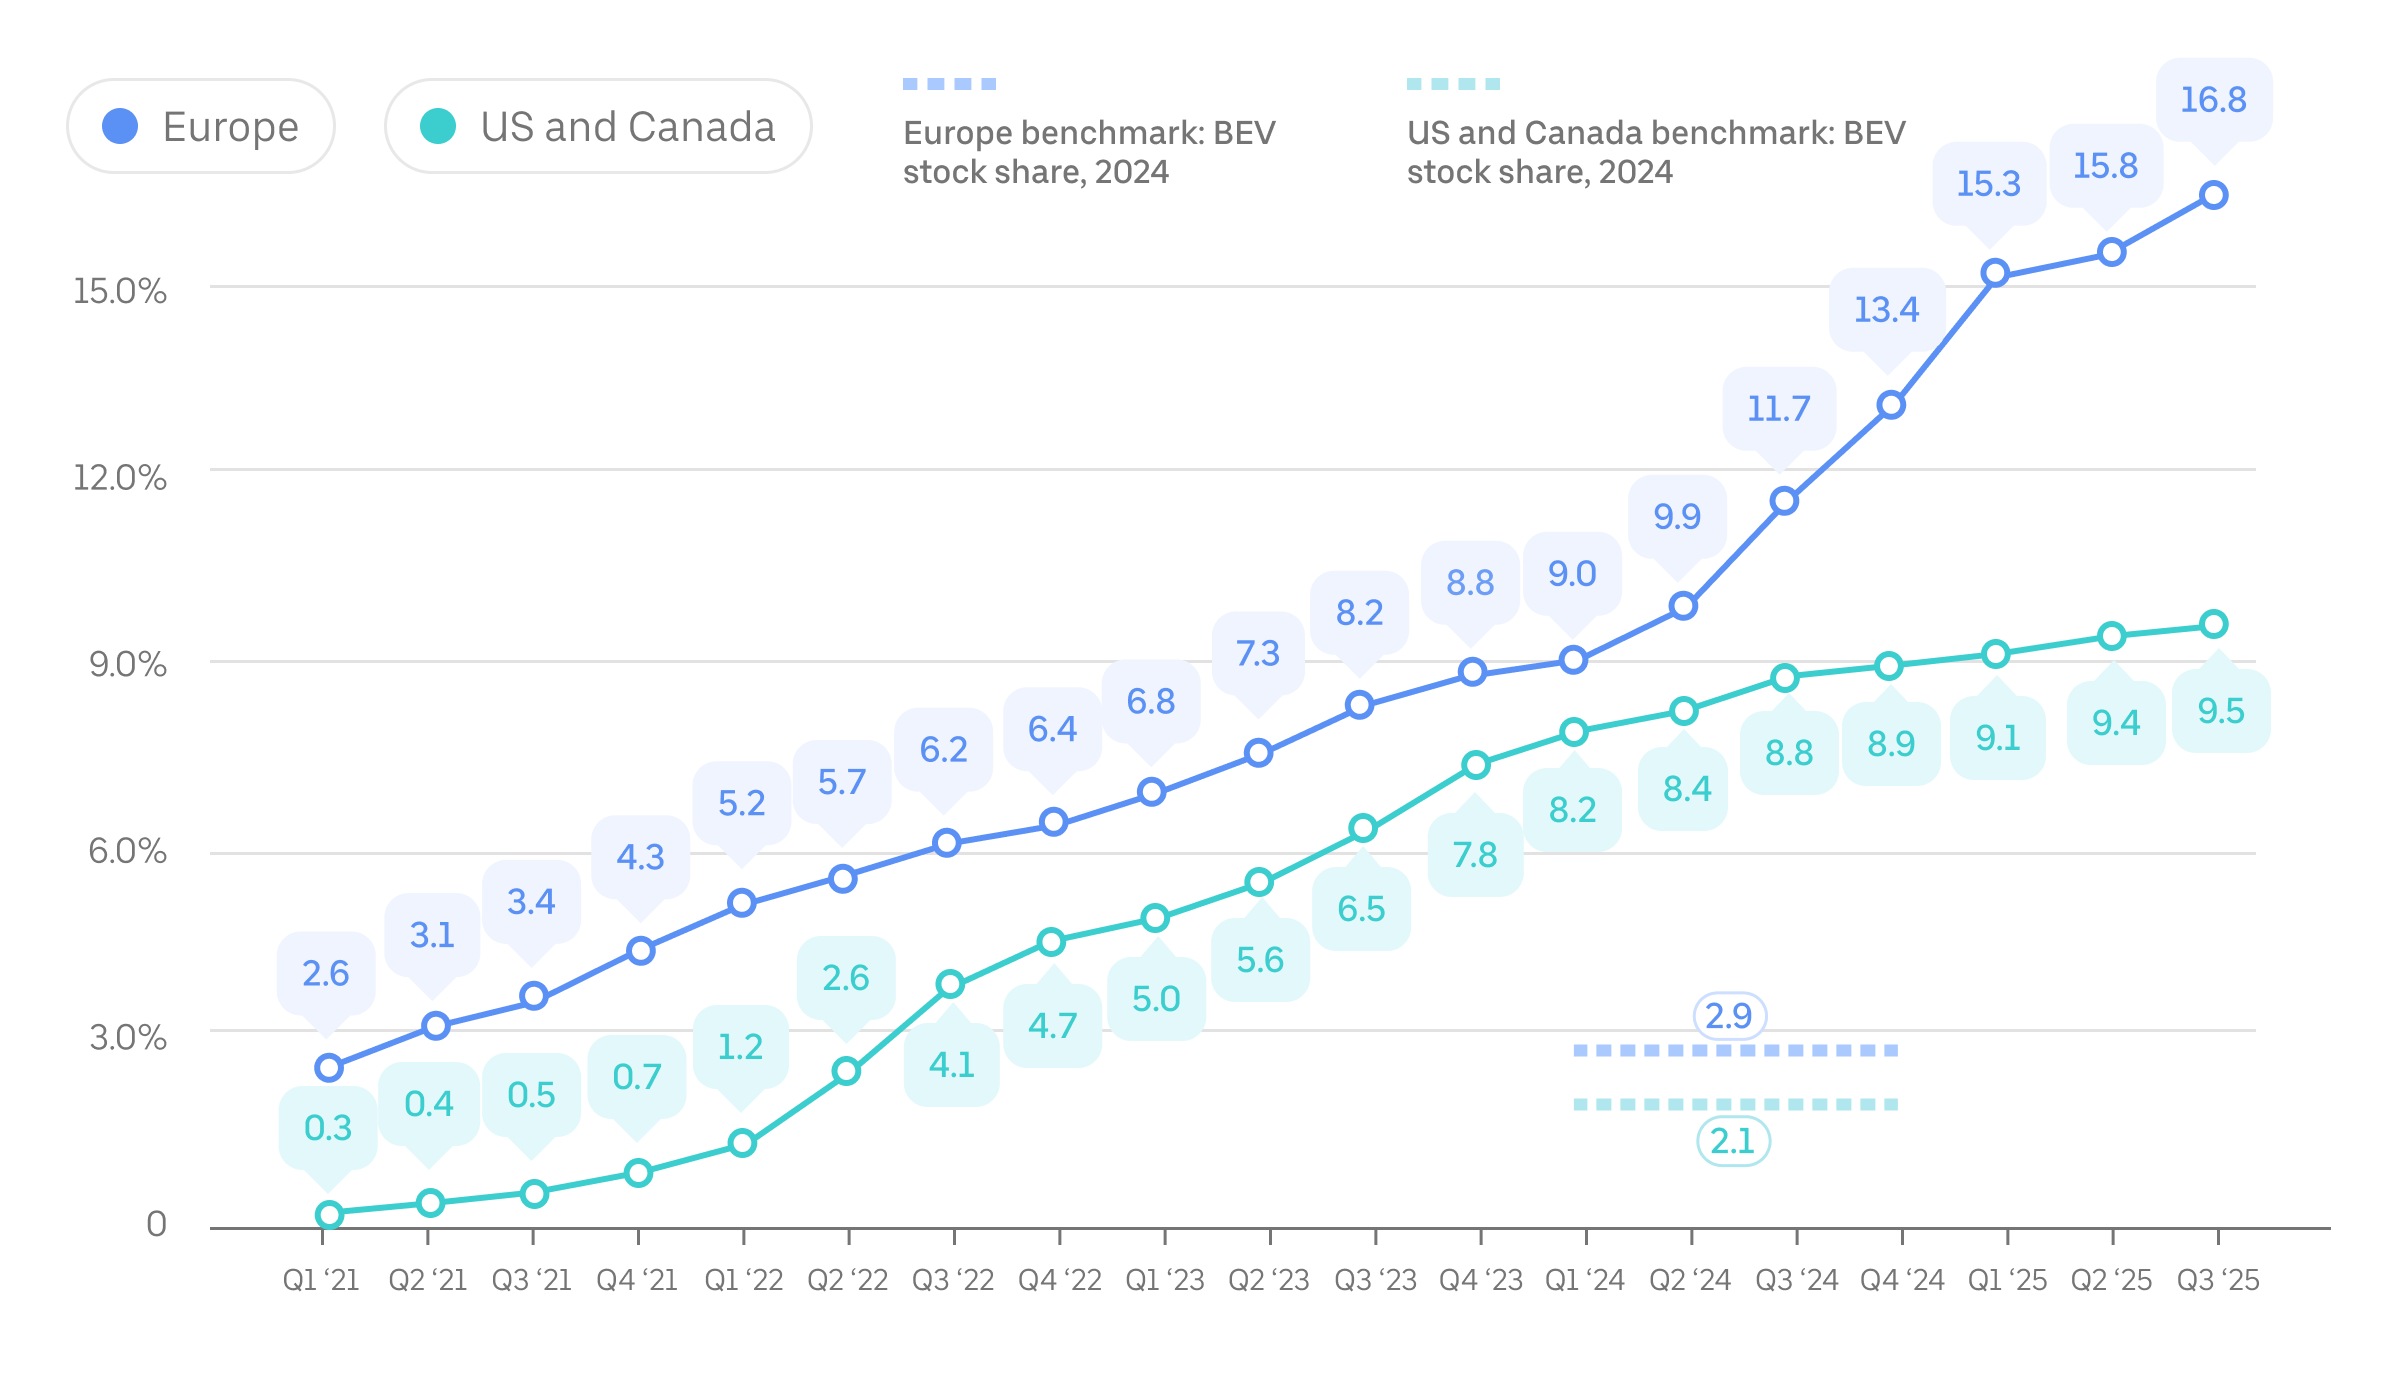
Metric: Share of on-trip miles completed in ZEVs compared with all on-trip miles arranged by the Uber app, by quarter since Q1 2021. Canada, US, and Europe benchmark data is as of 2024 (the most recently available at the time of this update) and is sourced from the International Energy Agency. “BEV” refers to battery electric vehicles.
Sõitja süsinikdioksiidi määr
2024. aastal tekitas iga sõitja Uberi kaudu sõites läbitud miil Euroopas keskmiselt 197 grammi CO₂ (ehk 123 grammi CO₂ kilomeetri kohta) ning 340 grammi CO₂ USA-s ja Kanadas (ehk 212 grammi CO₂ kilomeetri kohta). Võrreldes 2021. aastaga langes see sõitjate süsinikusisalduse näitaja Euroopas peaaegu 14% ning USA-s ja Kanadas 6%.
Aastatel 2023-2024 kasvas sõitjate süsinikdioksiidi määr pisut nii Euroopas, USA-s kui ka Kanadas. Selle põhjuseks on asjaolu, et sõitjaid tegid keskmiselt pisut vähem sõite ja kasvas ka „tühisõitude“ arv (st suurenes sõiduki läbisõit enne sõitjate pealevõtmist ja enne seda).
Metric: Passenger carbon intensity, or the estimated grams of CO₂ per passenger mile traveled, is an annual efficiency metric used by Uber—and, increasingly, governments and companies around the world. In the case of ridesharing, or any on-demand mobility service, emissions produced by any deadhead miles are factored into the calculation.
For more details about how we calculate passenger carbon intensity, go to our methodology document. Note that significantly lower average fuel economy for vehicles on Uber in Europe versus the US and Canada explains most of the difference in carbon intensity in these 2 geographies. While the composition of vehicles that drivers use on Uber’s app in Europe is more efficient (with a higher proportion of ZEVs and hybrids), more-stringent fuel economy reporting standards in the US also contributes to this discrepancy. In addition, we lack access to sufficient input data to calculate passenger carbon intensity for trips completed in European markets before 2021.
Ülevaated ja põhjalikud uuringud
Say hello to Uber Electric (2025)
Electrifying ridehail in the US and Canada (2025)
„Elektrisõidukid kõigile: valmiva tehnoloogia tasakaalustatud kasutuselevõtt (2024)“
Muudame kestlikkuse paremaks valikuks (2024)
„Kuidas suurendada elektrisõidukite kasutamist kogu Euroopas (2024)?“
Säästva marsruudiga heitkoguste vähendamine (2023)
Mobiilsuse mõõtmine süsinikdioksiidi määra jaoks (2019)
Korduma kippuvad küsimused
- Mis on Uberi elektrifitseerimise uuenduses?
Meie elektrifitseerimise uuendus pakub huvitatud sidusrühmadele tulemuspõhiseid näitajaid süsinikuheite ja elektrifitseerimise kohta Uberi rakenduses lubatud sõiduautosõitude puhul.
- Miks Sa selle uuenduse avaldad?
See uuendus, mis põhineb meie platvormi reaalsel kasutamisel, aitab tagada meie elektrifitseerimise mõju suurema läbipaistvuse ja parandab võimalusi pakkuda tõhusamat platvormi.
- Milliseid põhinäitajaid elektrifitseerimise uuenduses kasutad?
Mõõdikud hõlmavad järgmist.
- Uberi juhtide nullheitega sõidukite kasutusele võtmine (osakaal sõidu miilidest või kilomeetritest, mis on läbitud nullheitega sõidukitega), mis mõõdab meie edusamme seoses eesmärgiga saavutada 2040. aastaks 100% saastevaba liikumine kogu maailmas
- Sõitja süsinikdioksiidi määr, mis mõõdab iga sõidetud miili tulemusena tekkinud heitkoguseid
- Kuidas see uuendus parandab Uberi sõitude heitkoguste vähendamist ja elektrifitseerimist?
Meie suurte ambitsioonide hulka kuulub soov vähendada sõitja süsinikdioksiidi määra ja suurendada Uberis nullheitega sõidukite kasutamist. Edusammude mõõtmine ja läbipaistvus on meie teekonnal olulised sammud.
- Kas sõitjad teevad Uberiga sõite, kasutades neid madalama süsinikuheitega valikute (nagu ühistransport) asemel?
Uberi rakenduse kaudu tehtud sõidud on üks paljudest sõitu otsivate inimeste jaoks saadaolevatest transpordivõimalustest. Sõidu valik sõltub suuresti erinevatest kohaliku turu tingimustest. Meie USA riikliku leibkonna reisimise uuringu analüüsi andmed näitavad, et kõige säästvamate transpordiliikide (transiit, kõndimine ja jalgrattasõit) suurem kasutamine leibkonna kohta on korrelatsioonis sõidujagamise ja muude tellitavate lahenduste suurema kasutamisega.
- Kas mõõdad samu andmeid teiste maailma riikide või piirkondade kohta?
Many of the above metrics now cover all passenger trips completed with the Uber app globally. We regularly report on carbon emissions and other impact areas resulting from trips on Uber.
- Kui kiiresti loodate Uberi elektrifitseerimise uuenduse esitada?
Värskendame kõiki mõõdikuid vähemalt kord aastas ja mõningaid mõõdikuid võime värskendada ka sagedamini. Avaldame heitkoguste mõõdikud (nt sõitjate süsinikdioksiidi määr) igal aastal kalendriaastate kaupa.
- Mida mõeldakse “nullheitega sõiduki” all?
We use the term “zero-emission vehicle” (ZEV) the same way the California Air Resources Board (CARB) and Europe’s Transport & Environment (T&E) do: to refer to vehicles that produce no direct CO₂ emissions or other criteria air pollutants (such as NOx, particulate matter, CO₂, and SOx) from the on-board source of power. Regional variations should be considered at the reader’s discretion.
Drivers using Uber’s app use 2 types of ZEVs today: battery electric vehicles (battery EVs) and, very occasionally, hydrogen-powered fuel cell electric vehicles (FCEVs).
Of course, the “zero” in ZEV refers to no emissions from the proverbial “tailpipe” of the vehicle and not necessarily all the emissions that can be accounted for from production to disposal of the vehicle and its energy source. All accounted for, however, life-cycle analyses by independent experts show that “emissions over the lifetime of average medium-size battery EVs registered today are already lower than comparable gasoline cars by 66%–69% in Europe, 60%–68% in the United States, 37%–45% in China, and 19%–34% in India.”
- Kas mõõdad, millist mõju omab Sinu kohaletoimetamisettevõte?
Our Electrification Update currently covers electrification and emissions metrics only for our Mobility business (ridesharing). We aim to include our progress on delivery emissions and electrification in the future.
In terms of packaging, Uber continues to invest in helping merchants transition to sustainable options. As with electrification, however, progress depends on collective action. We’re prioritizing efforts in cities where public and private investments are aligned. For example, in France over 60% of packaging used on the platform is recyclable, reusable, or compostable, supported by national policy and local incentives.
While progress has been made, based on current trends we cannot meet all 2025 goals, and our 2030 goals will be out of reach without stronger, coordinated action across government and industry.
While many key levers are outside our control, we remain deeply committed to this transition. To learn more about Uber’s approach to more-sustainable packaging with merchants, consult our Uber Eats for Merchants web page.
- Kas Uber avalikustab 1., 2. ja 3. reguleerimisala heitkoguseid. Kui jah, siis kust neid andmeid leida?
Uber discloses Scope 1, 2, and 3 emissions in our Governance Strategy and Engagement Report and to CDP. You can find our most recent score in CDP’s public corporate score search. These emissions estimates have received limited assurance from an independent third party.
This page and the related information, updates, reports, and web pages (the “Report”) contain forward-looking statements regarding our future business expectations and goals, which involve risks and uncertainties. Actual results may differ materially from the results anticipated. Additionally, this Report is provided for informational purposes only and should not be relied upon for business or vehicle acquisition decisions. Undue reliance should not be placed on the forward-looking statements. We undertake no duty to update this information unless required by law. For more information on Uber’s strategy, please go to investor.uber.com.
Certain data disclosed in this Report has received limited assurance from LRQA. Data discrepancies with assurance may be present due to rounding methodologies.
The use of terms in this Report such as “drivers,” “couriers,” “earn,” “zero- emission vehicle,” and “sustainable packaging” are general and follow the general use case of the words by Uber Technologies, Inc. Regional variations of words should be considered at the reader’s discretion.
An overview of Uber's use of carbon offsets can be found here.
Teave
Teave