Uberova obavijest o elektrifikaciji
Q3 2025 update: This page includes metrics for trips completed on Uber by internal combustion engine vehicles and zero-emission vehicles (ZEVs, such as battery EVs) from the beginning of the first quarter of 2021 to the end of the third quarter of 2025. Note that the scope of this report includes only Uber’s Mobility business (ridesharing).
Praćenje našeg puta do nulte stope emisija
Five years into our ambitious efforts to transition to a zero-emission platform, we’ve made meaningful progress. Today, Uber is the world's most widely available platform for zero-emission rides, with drivers adopting EVs (electric vehicles) up to 5 times faster than average motorists in the US, Canada, and Europe.
We’ve invested hundreds of millions of dollars to help interested drivers make the switch to electric through incentives, partnerships, and product enhancements—and it’s paying off. Increasingly, riders are experiencing their first EV on Uber, helping to normalize and accelerate the adoption of electric transport all over the world.
Our data shows that EV progress quickens when government and industry work together to get the economics right. In cities like London, Vancouver, and Amsterdam, where thoughtful policies, industry investment, and strong charging networks align, more than 1 in every 3 miles on Uber are now electric.
Despite this significant progress, major barriers remain to fully achieving our goals. High upfront EV costs, limited charging access, and inconsistent policy support continue to slow adoption. Based on current trends, we cannot meet our remaining mobility and delivery goals for 2025, and our 2030 goals will be out of reach without stronger, coordinated action across government and industry.
As we’ve said from the start: Climate is a team sport, and progress depends on collective action. That’s why we’re increasingly prioritizing efforts in cities where public and private investment are aligned.
While many key levers are outside our control, we remain deeply committed to this transition—not just because it’s the right thing to do, but also because it brings direct and strategic business benefits. Thousands of drivers around the world are taking home more money thanks to lower EV operating costs and rider demand for electric vehicles. Riders report higher satisfaction with the EV experience and are increasingly choosing EVs.
And finally, the future is shared, electric, and autonomous—and the coming wave of autonomous (electric) vehicles will create a major tailwind in achieving our sustainability goals.
Our latest update below outlines the progress to date, key insights, and areas of focus for 2025 and beyond.
Vozači ZEV-ova
Globally, more than 286,000 ZEV drivers were active on Uber’s app in Q3 2025. That’s over 57% more than the same period a year earlier.
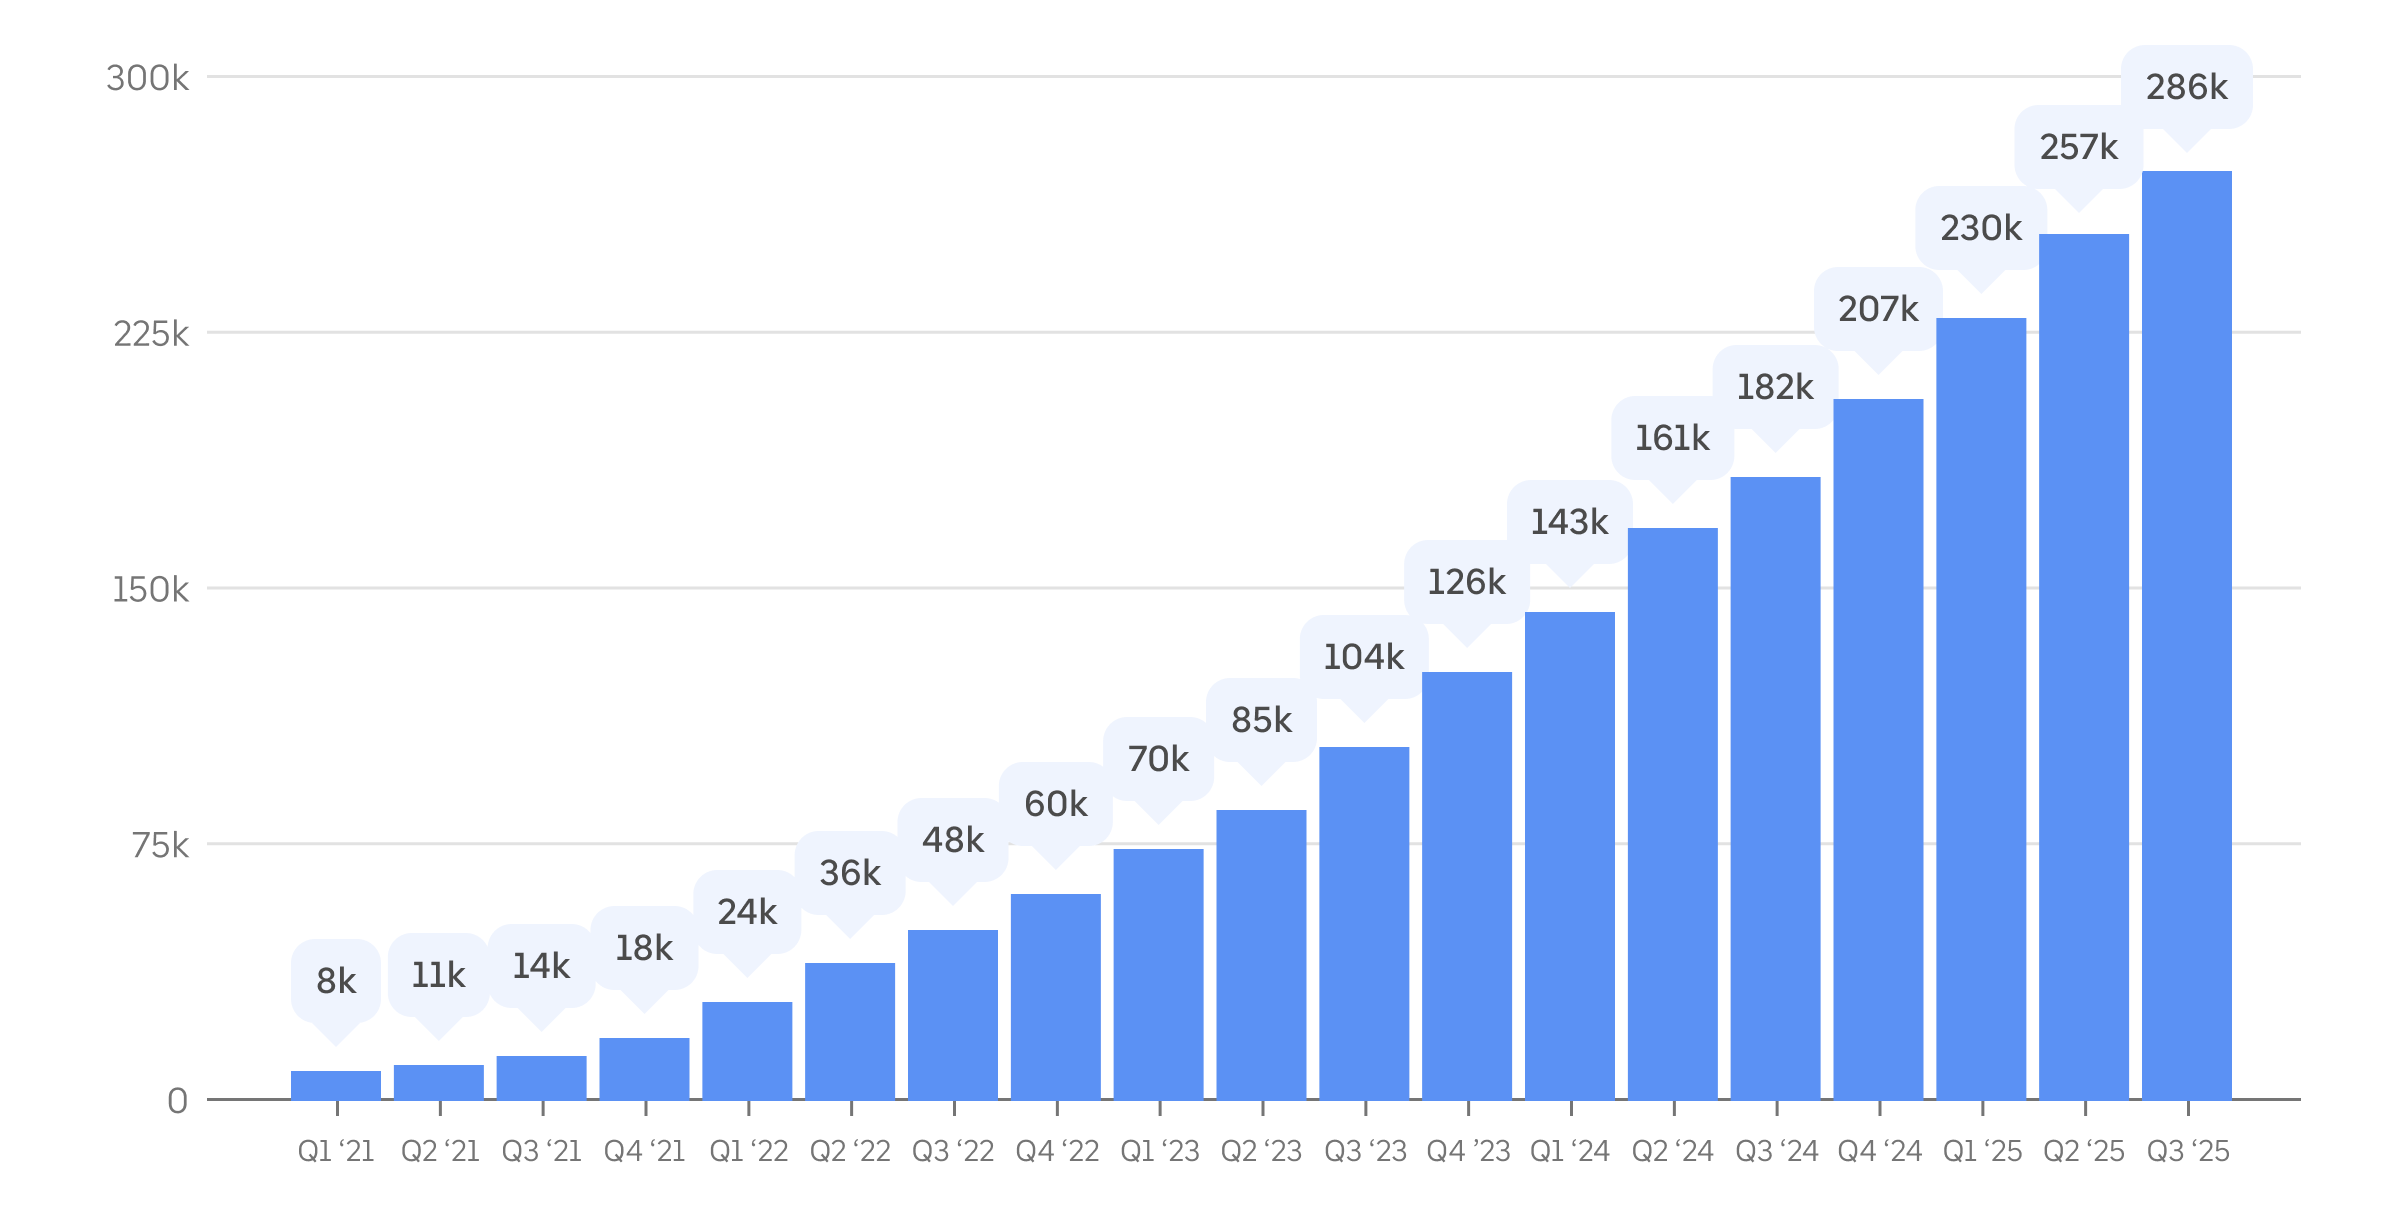
Mjerni podaci: Prosječni broj aktivnih vozača ZEV-a na Uberu mjesečno po tromjesečju od 1. tromjesečja 2021. Vozači koji se koriste aplikacijom Uber računaju se kao aktivni u određenom mjesecu ako su dovršili najmanje jednu vožnju u tom kalendarskom mjesecu.
vožnje ZEV-om
In Q3 2025, ZEV drivers completed over 136 million trips using Uber, globally. That’s more than 17 ZEV trips on Uber every second, on average. The Q3 2025 total is 60% more than the number of ZEV trips completed on Uber during the same period a year earlier.
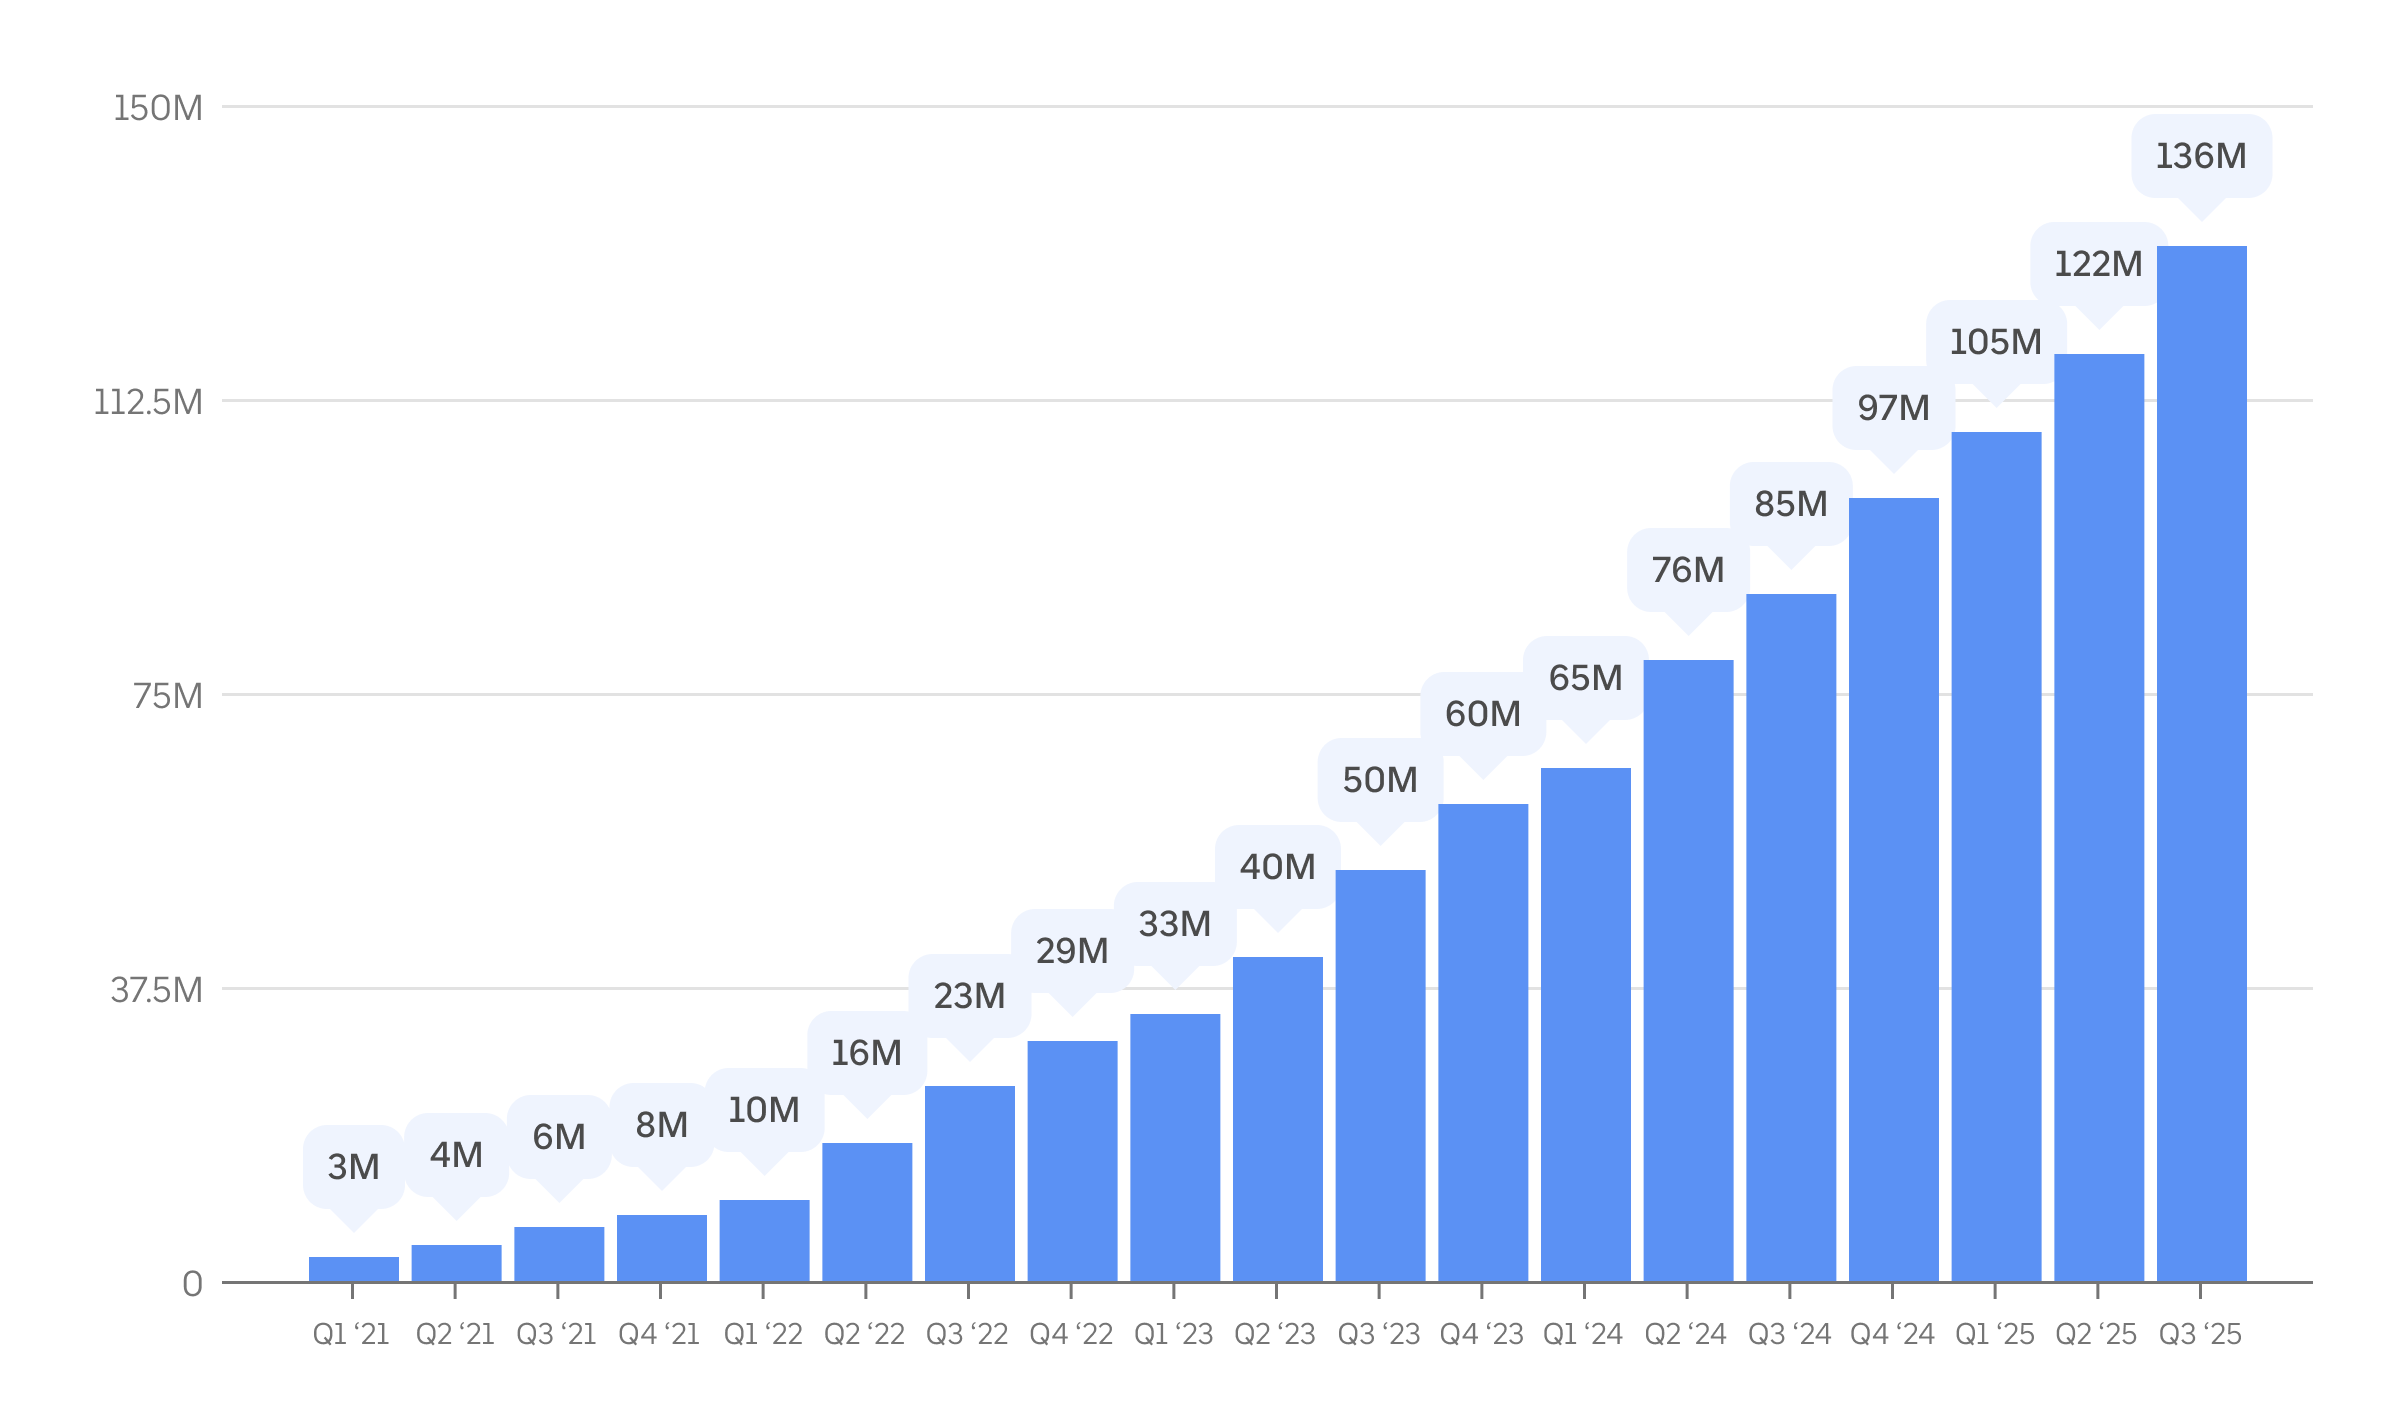
Mjerni podaci: broj vožnji dogovorenih putem aplikacije Uber koje su dovršili vozači ZEV-ova po tromjesečju od 1. tromjesečja 2021.
širenje upotrebe ZEV-ova
In Q3 2025, ZEV drivers completed 16.8% of all on-trip miles in Europe and 9.5% of all on-trip miles in Canada and the US—adoption levels many times above drivers in the general public.
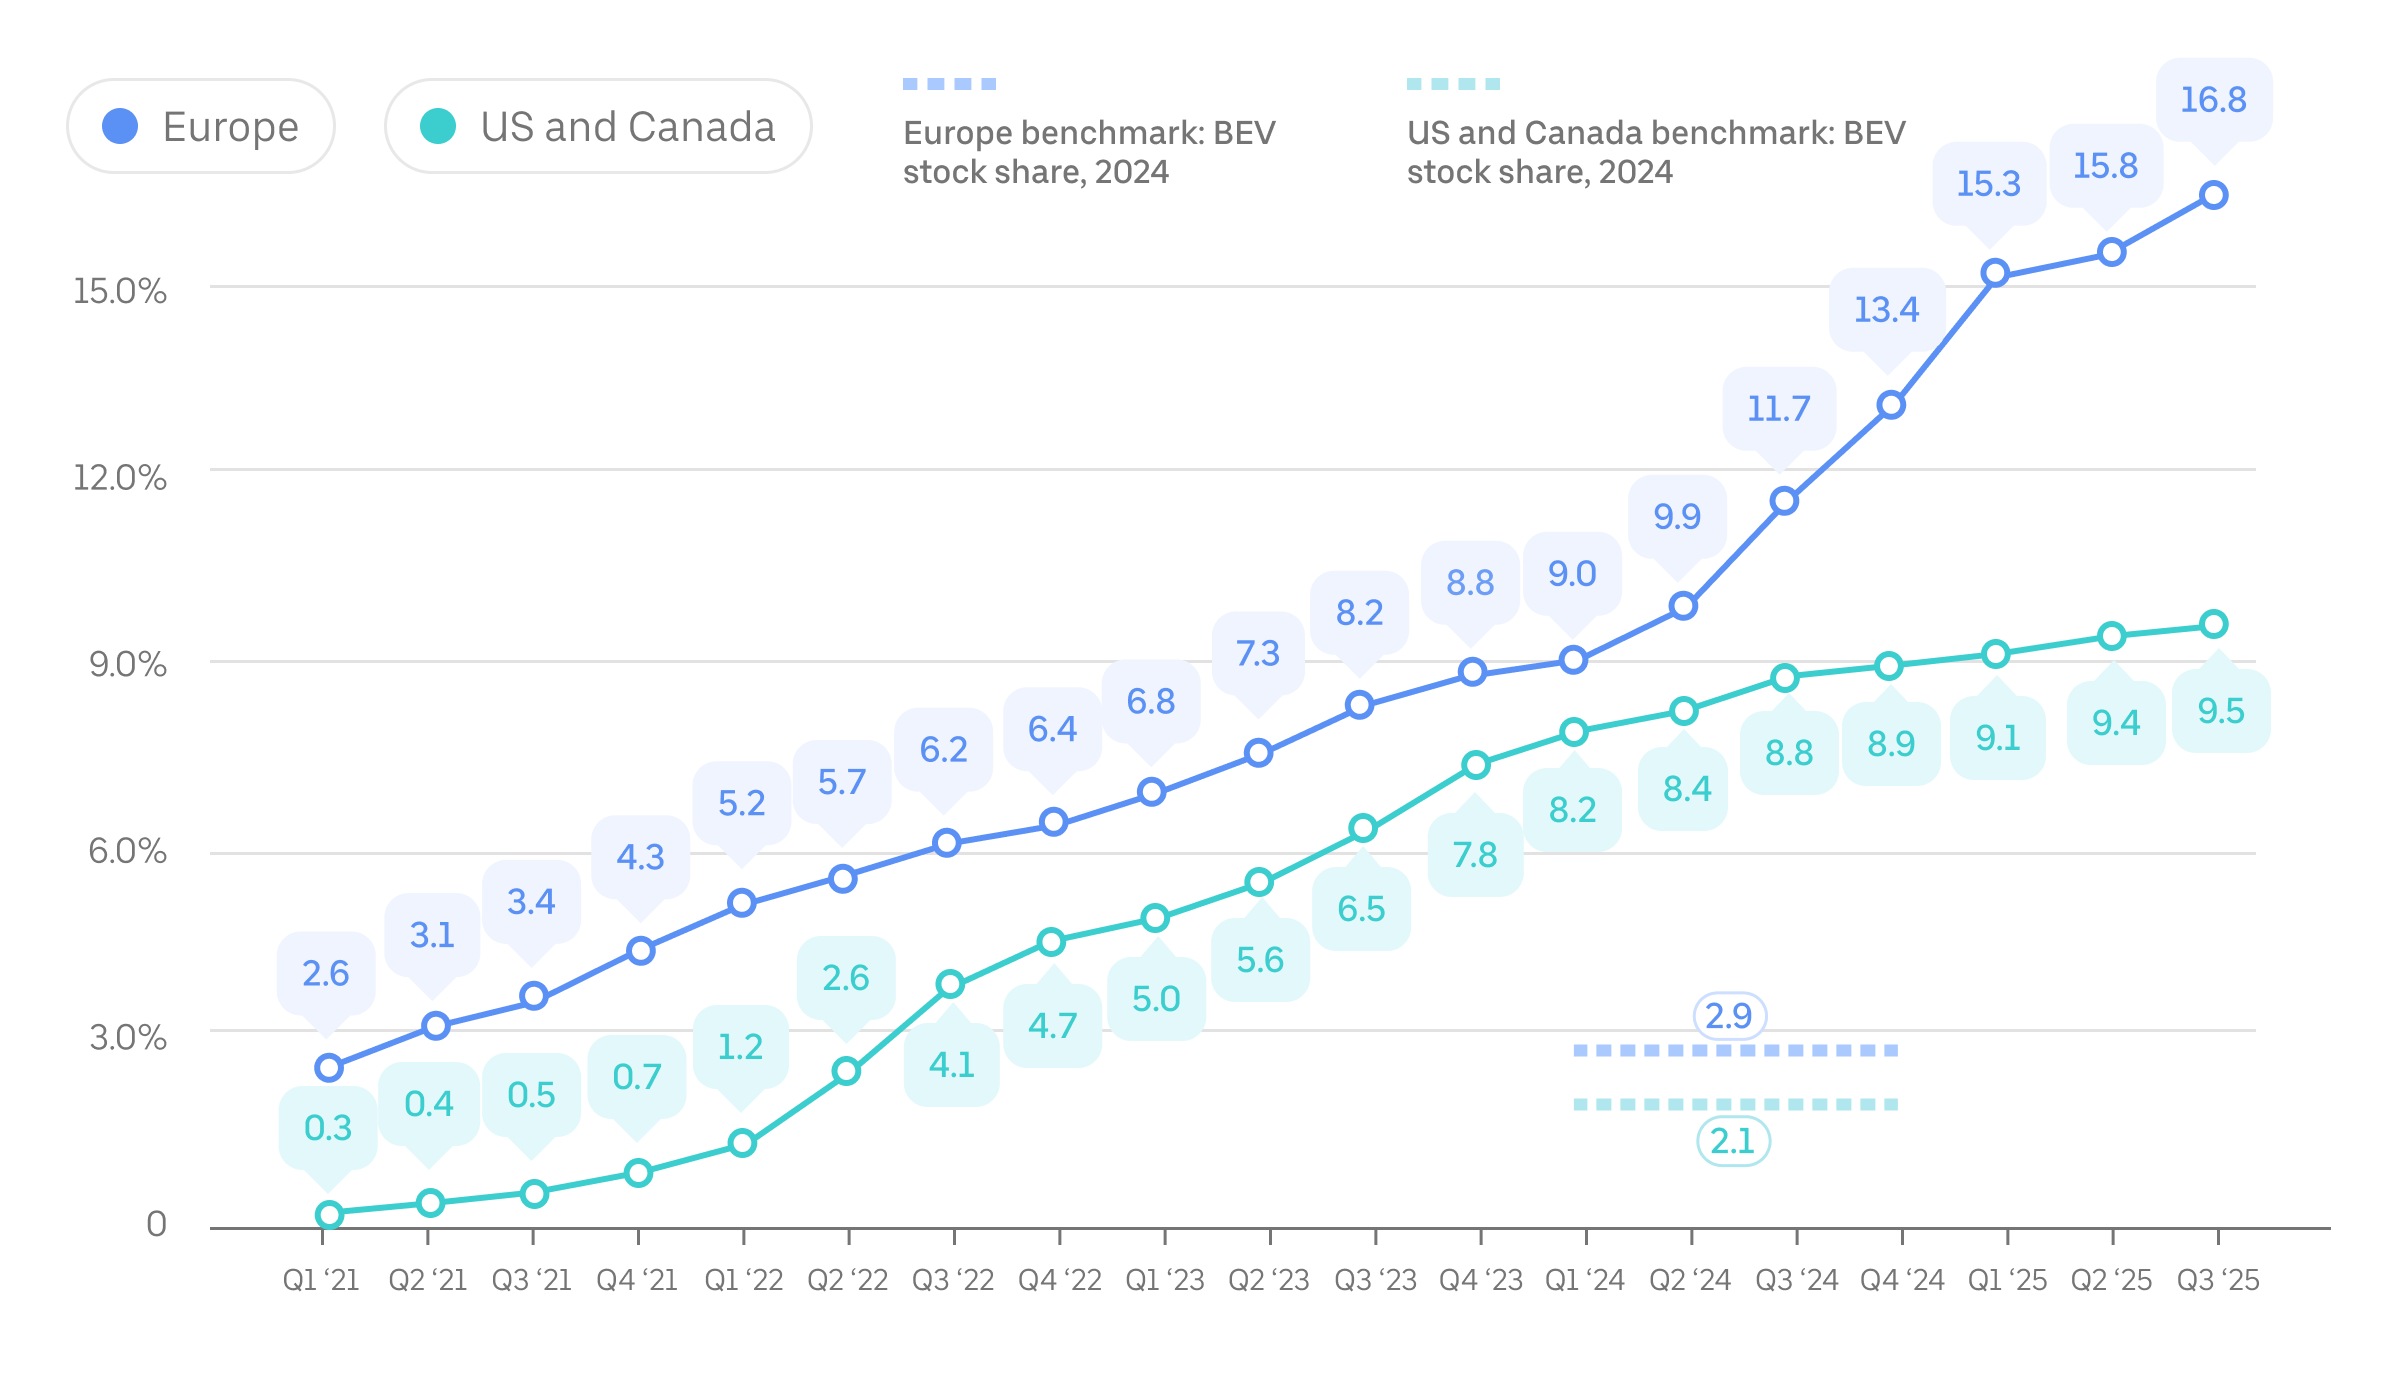
Metric: Share of on-trip miles completed in ZEVs compared with all on-trip miles arranged by the Uber app, by quarter since Q1 2021. Canada, US, and Europe benchmark data is as of 2024 (the most recently available at the time of this update) and is sourced from the International Energy Agency. “BEV” refers to battery electric vehicles.
Intenzitet ugljičnih emisija u korisnika
U 2024. svaka milja koju je korisnik prešao na Uberu rezultirala je prosječnom proizvodnjom od 197 grama CO₂ u Europi (ili 123 grama CO₂ po kilometru) te 340 grama CO₂ u SAD-u i Kanadi (ili 212 grama CO₂ po kilometru). U usporedbi s 2021. taj je mjerni podatak o intenzitetu ugljičnih emisija u korisnika pao za gotovo 14 % u Europi te za 6 % u SAD-u i Kanadi.
Intenzitet ugljičnih emisija u korisnika u Europi, SAD-u i Kanadi blago se povećao između 2023. i 2024. zbog manjih smanjenja prisutnosti korisnika i povećanja „vožnje bez tereta” (kilometraža vozila prijeđena prije i na putu do preuzimanja korisnika).
Metric: Passenger carbon intensity, or the estimated grams of CO₂ per passenger mile traveled, is an annual efficiency metric used by Uber—and, increasingly, governments and companies around the world. In the case of ridesharing, or any on-demand mobility service, emissions produced by any deadhead miles are factored into the calculation.
For more details about how we calculate passenger carbon intensity, go to our methodology document. Note that significantly lower average fuel economy for vehicles on Uber in Europe versus the US and Canada explains most of the difference in carbon intensity in these 2 geographies. While the composition of vehicles that drivers use on Uber’s app in Europe is more efficient (with a higher proportion of ZEVs and hybrids), more-stringent fuel economy reporting standards in the US also contributes to this discrepancy. In addition, we lack access to sufficient input data to calculate passenger carbon intensity for trips completed in European markets before 2021.
Detaljniji uvidi i podaci
Say hello to Uber Electric (2025)
Electrifying ridehail in the US and Canada (2025)
Električna vozila za sve: uravnoteženo prihvaćanje tehnologije koja sazrijeva (2024.)
Uspostavljanje održivosti kao boljim izborom (2024.)
Kako pridonijeti poticanju električne mobilnosti diljem Europe (2024.)
Ušteda emisija održivim usmjeravanjem (2023.)
Mjerenje mobilnosti za intenzitet ugljika (2019.)
Često postavljana pitanja
- Što sadrži Uberova obavijest o elektrifikaciji?
U našoj obavijesti o elektrifikaciji zainteresiranim dionicima pružamo mjerne podatke o učinku na temelju ugljičnih emisija i elektrifikacije za vožnje vozila s korisnicima koje omogućuje aplikacija Uber.
- Zašto objavljuješ ovu obavijest?
Ova obavijest, koja se temelji na upotrebi našeg sustava za pružanje usluga mobilnosti u stvarnom svijetu, pomaže u osiguravanju veće transparentnosti našeg utjecaja elektrifikacije i pomaže nam da poboljšamo nastojanja kako bismo podržali učinkovitost našeg sustava.
- Koja su ključna mjerenja koja se upotrebljavaju u obavijesti o elektrifikaciji?
Mjerni podaci uključuju sljedeće:
- Širenje upotrebe ZEV-ova vozača na usluzi Uber (udio milja ili kilometara prijeđenih u ZEV-ovima tijekom vožnji), kojom se mjeri naš napredak prema cilju od 100 % mobilnosti bez emisija na Uberu do 2040.
- Intenzitet ugljičnih emisija u korisnika, kojim se mjere emisije koje proizlaze iz svakog prijeđenog kilometra
- Kako će se ovom obavijesti poboljšati smanjenje stope emisija i šira upotreba elektrifikacije za vožnje na Uberu?
Imamo odvažne ambicije smanjiti intenzitet ugljičnih emisija u korisnika tijekom vožnji i povećati upotrebu vozila s nultom stopom emisija na Uberu. Mjerenje i transparentnost napretka važni su koraci na našem putu.
- Voze li se korisnici Uberom umjesto da upotrebljavaju opcije s manjim ugljičnim otiskom poput javnog prijevoza?
Vožnje putem aplikacije Uber jedna su od brojnih opcija vožnje dostupnih osobama koje traže vožnju. Izbor vožnje uvelike ovisi o raznim lokalnim tržišnim uvjetima. Naša analiza podataka američke nacionalne ankete o putovanju u kućanstvima pokazuje da je veće iskorištavanje najodrživijih načina prijevoza (prijevoz, pješačenje i biciklizam) po kućanstvu u uzajamnoj vezi s većim iskorištavanjem dijeljenja vožnje i drugih rješenja na zahtjev.
- Hoćeš li mjeriti iste podatke za druge zemlje ili regije diljem svijeta?
Many of the above metrics now cover all passenger trips completed with the Uber app globally. We regularly report on carbon emissions and other impact areas resulting from trips on Uber.
- Koliko često očekuješ da ćeš dostavljati Uberove obavijesti o elektrifikaciji?
Mjerne podatke ažuriramo najmanje jednom godišnje, a neke mjerne podatke možemo ažurirati i češće. Mjerne podatke o emisijama (kao što je intenzitet ugljika u korisnika) objavljivat ćemo svake godine, agregirane po kalendarskim godinama.
- Što podrazumijevaš pod „vozilom s nultim emisijama”?
We use the term “zero-emission vehicle” (ZEV) the same way the California Air Resources Board (CARB) and Europe’s Transport & Environment (T&E) do: to refer to vehicles that produce no direct CO₂ emissions or other criteria air pollutants (such as NOx, particulate matter, CO₂, and SOx) from the on-board source of power. Regional variations should be considered at the reader’s discretion.
Drivers using Uber’s app use 2 types of ZEVs today: battery electric vehicles (battery EVs) and, very occasionally, hydrogen-powered fuel cell electric vehicles (FCEVs).
Of course, the “zero” in ZEV refers to no emissions from the proverbial “tailpipe” of the vehicle and not necessarily all the emissions that can be accounted for from production to disposal of the vehicle and its energy source. All accounted for, however, life-cycle analyses by independent experts show that “emissions over the lifetime of average medium-size battery EVs registered today are already lower than comparable gasoline cars by 66%–69% in Europe, 60%–68% in the United States, 37%–45% in China, and 19%–34% in India.”
- Hoćeš li mjeriti utjecaj na svoje poslovanje dostave?
Our Electrification Update currently covers electrification and emissions metrics only for our Mobility business (ridesharing). We aim to include our progress on delivery emissions and electrification in the future.
In terms of packaging, Uber continues to invest in helping merchants transition to sustainable options. As with electrification, however, progress depends on collective action. We’re prioritizing efforts in cities where public and private investments are aligned. For example, in France over 60% of packaging used on the platform is recyclable, reusable, or compostable, supported by national policy and local incentives.
While progress has been made, based on current trends we cannot meet all 2025 goals, and our 2030 goals will be out of reach without stronger, coordinated action across government and industry.
While many key levers are outside our control, we remain deeply committed to this transition. To learn more about Uber’s approach to more-sustainable packaging with merchants, consult our Uber Eats for Merchants web page.
- Objavljuje li Uber emisije 1., 2. i 3. razine i, ako da, gdje bi ih se moglo pronaći?
Uber discloses Scope 1, 2, and 3 emissions in our Governance Strategy and Engagement Report and to CDP. You can find our most recent score in CDP’s public corporate score search. These emissions estimates have received limited assurance from an independent third party.
This page and the related information, updates, reports, and web pages (the “Report”) contain forward-looking statements regarding our future business expectations and goals, which involve risks and uncertainties. Actual results may differ materially from the results anticipated. Additionally, this Report is provided for informational purposes only and should not be relied upon for business or vehicle acquisition decisions. Undue reliance should not be placed on the forward-looking statements. We undertake no duty to update this information unless required by law. For more information on Uber’s strategy, please go to investor.uber.com.
Certain data disclosed in this Report has received limited assurance from LRQA. Data discrepancies with assurance may be present due to rounding methodologies.
The use of terms in this Report such as “drivers,” “couriers,” “earn,” “zero- emission vehicle,” and “sustainable packaging” are general and follow the general use case of the words by Uber Technologies, Inc. Regional variations of words should be considered at the reader’s discretion.
An overview of Uber's use of carbon offsets can be found here.
Informacije
Informacije