Ενημέρωση της Uber για την ηλεκτροκίνηση
Q3 2025 update: This page includes metrics for trips completed on Uber by internal combustion engine vehicles and zero-emission vehicles (ZEVs, such as battery EVs) from the beginning of the first quarter of 2021 to the end of the third quarter of 2025. Note that the scope of this report includes only Uber’s Mobility business (ridesharing).
Παρακολούθηση της πορείας μας προς τις μηδενικές εκπομπές
Five years into our ambitious efforts to transition to a zero-emission platform, we’ve made meaningful progress. Today, Uber is the world's most widely available platform for zero-emission rides, with drivers adopting EVs (electric vehicles) up to 5 times faster than average motorists in the US, Canada, and Europe.
We’ve invested hundreds of millions of dollars to help interested drivers make the switch to electric through incentives, partnerships, and product enhancements—and it’s paying off. Increasingly, riders are experiencing their first EV on Uber, helping to normalize and accelerate the adoption of electric transport all over the world.
Our data shows that EV progress quickens when government and industry work together to get the economics right. In cities like London, Vancouver, and Amsterdam, where thoughtful policies, industry investment, and strong charging networks align, more than 1 in every 3 miles on Uber are now electric.
Despite this significant progress, major barriers remain to fully achieving our goals. High upfront EV costs, limited charging access, and inconsistent policy support continue to slow adoption. Based on current trends, we cannot meet our remaining mobility and delivery goals for 2025, and our 2030 goals will be out of reach without stronger, coordinated action across government and industry.
As we’ve said from the start: Climate is a team sport, and progress depends on collective action. That’s why we’re increasingly prioritizing efforts in cities where public and private investment are aligned.
While many key levers are outside our control, we remain deeply committed to this transition—not just because it’s the right thing to do, but also because it brings direct and strategic business benefits. Thousands of drivers around the world are taking home more money thanks to lower EV operating costs and rider demand for electric vehicles. Riders report higher satisfaction with the EV experience and are increasingly choosing EVs.
And finally, the future is shared, electric, and autonomous—and the coming wave of autonomous (electric) vehicles will create a major tailwind in achieving our sustainability goals.
Our latest update below outlines the progress to date, key insights, and areas of focus for 2025 and beyond.
Οδηγοί ZEV
Globally, more than 286,000 ZEV drivers were active on Uber’s app in Q3 2025. That’s over 57% more than the same period a year earlier.
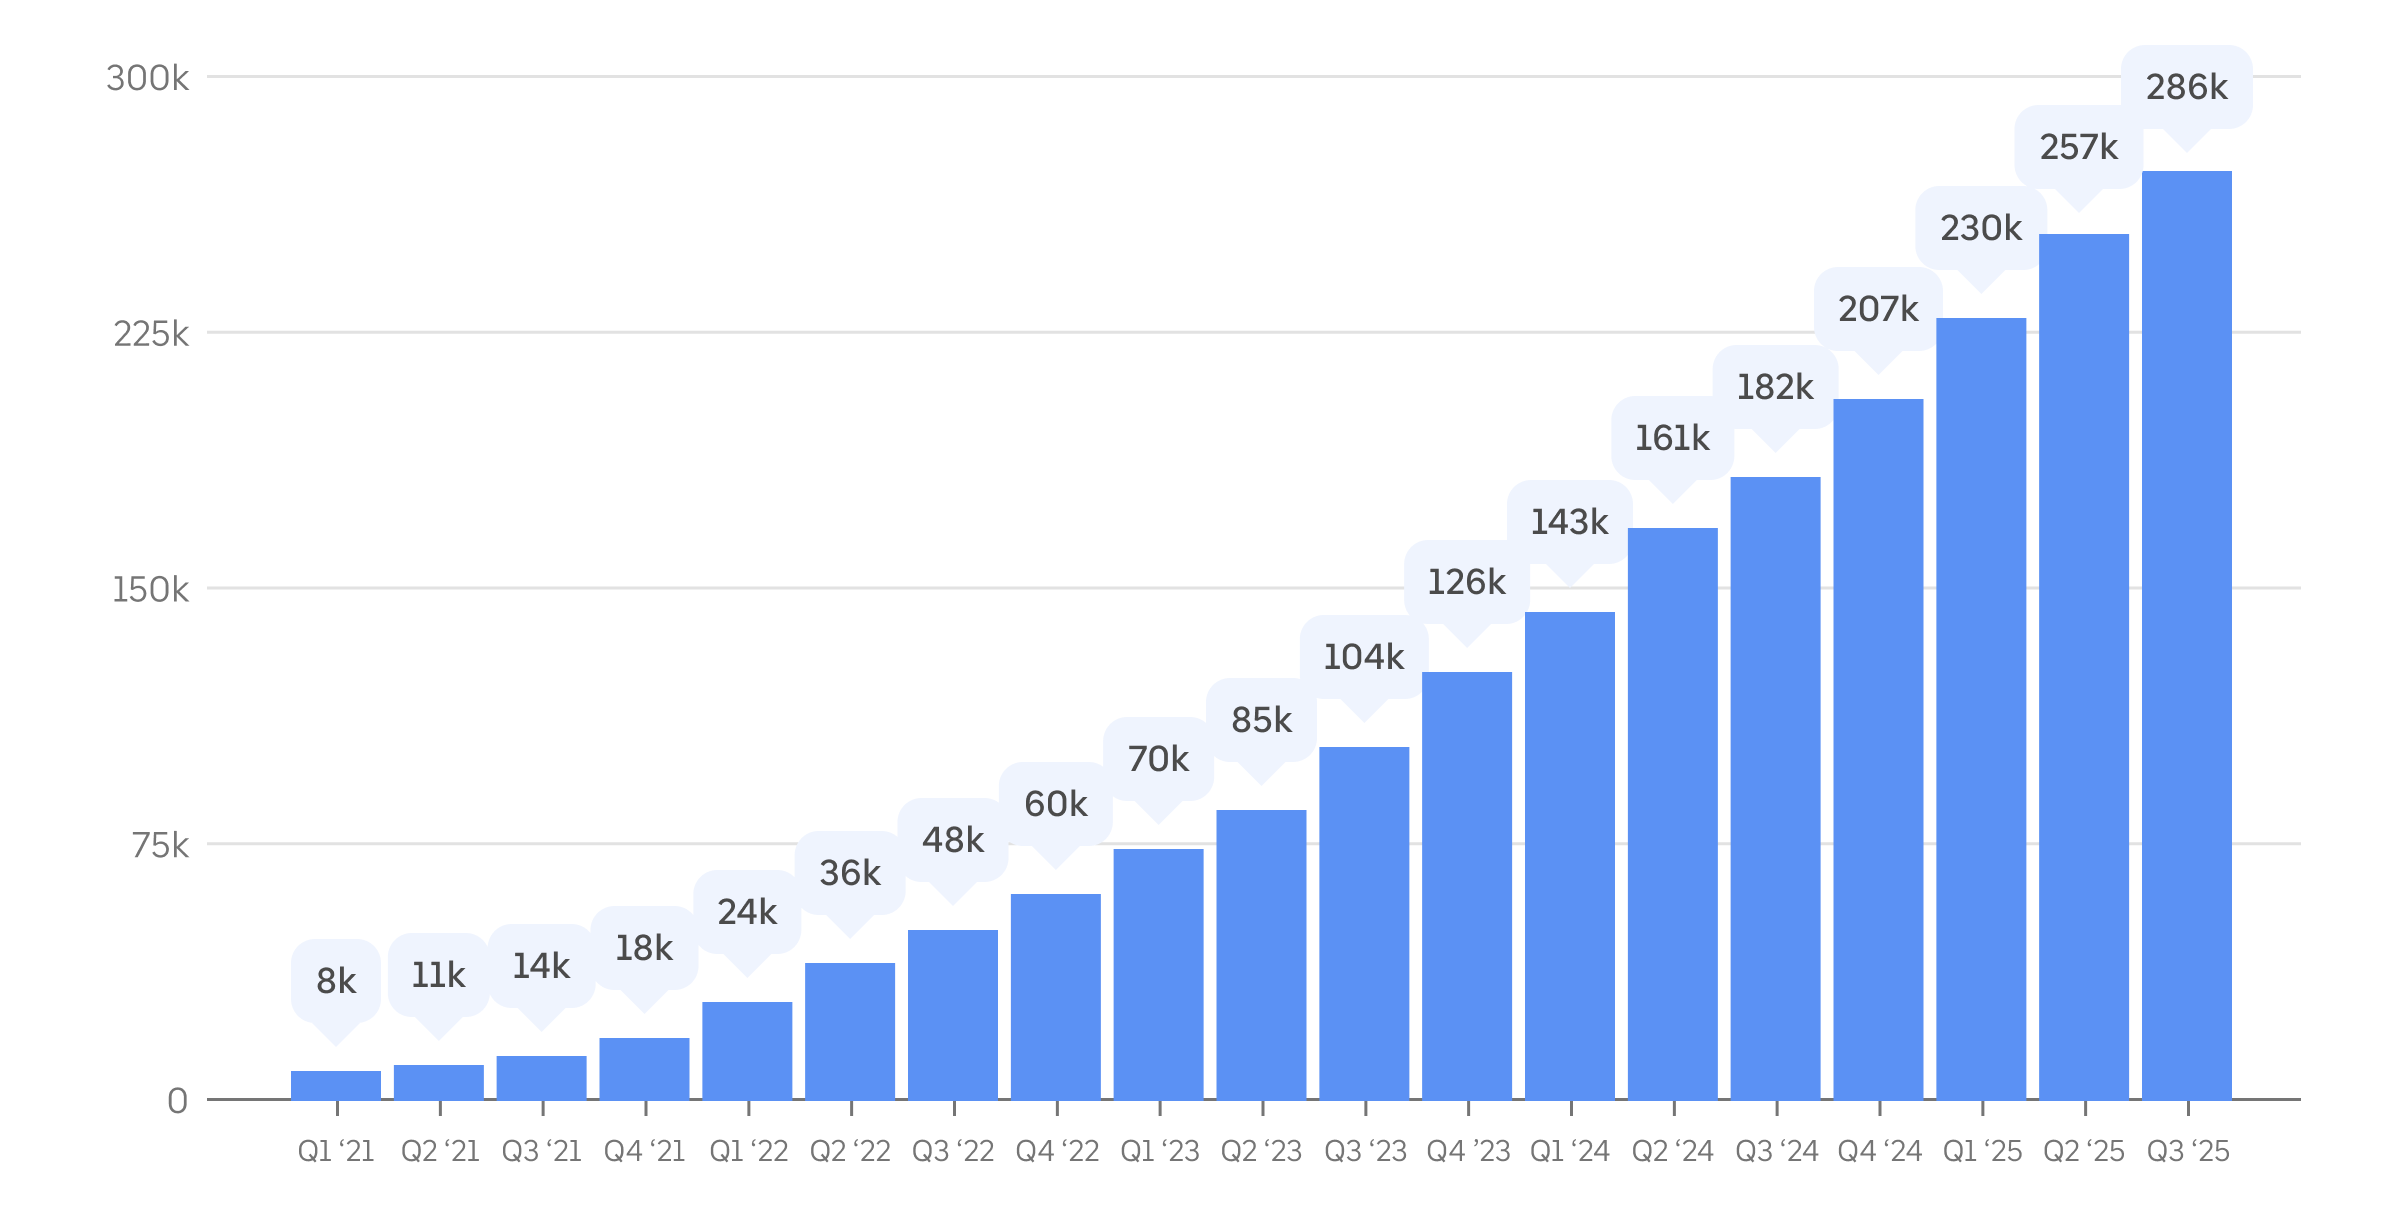
Μέτρηση: Μέσος όρος μηνιαίων ενεργών οδηγών ZEV στην Uber, ανά τρίμηνο, από το πρώτο τρίμηνο του 2021. Οι οδηγοί που χρησιμοποιούν την εφαρμογή της Uber υπολογίζονται ως ενεργοί σε έναν δεδομένο μήνα εάν έχουν πραγματοποιήσει τουλάχιστον μία μετακίνηση κατά τον συγκεκριμένο ημερολογιακό μήνα.
Διαδρομές ZEV
In Q3 2025, ZEV drivers completed over 136 million trips using Uber, globally. That’s more than 17 ZEV trips on Uber every second, on average. The Q3 2025 total is 60% more than the number of ZEV trips completed on Uber during the same period a year earlier.
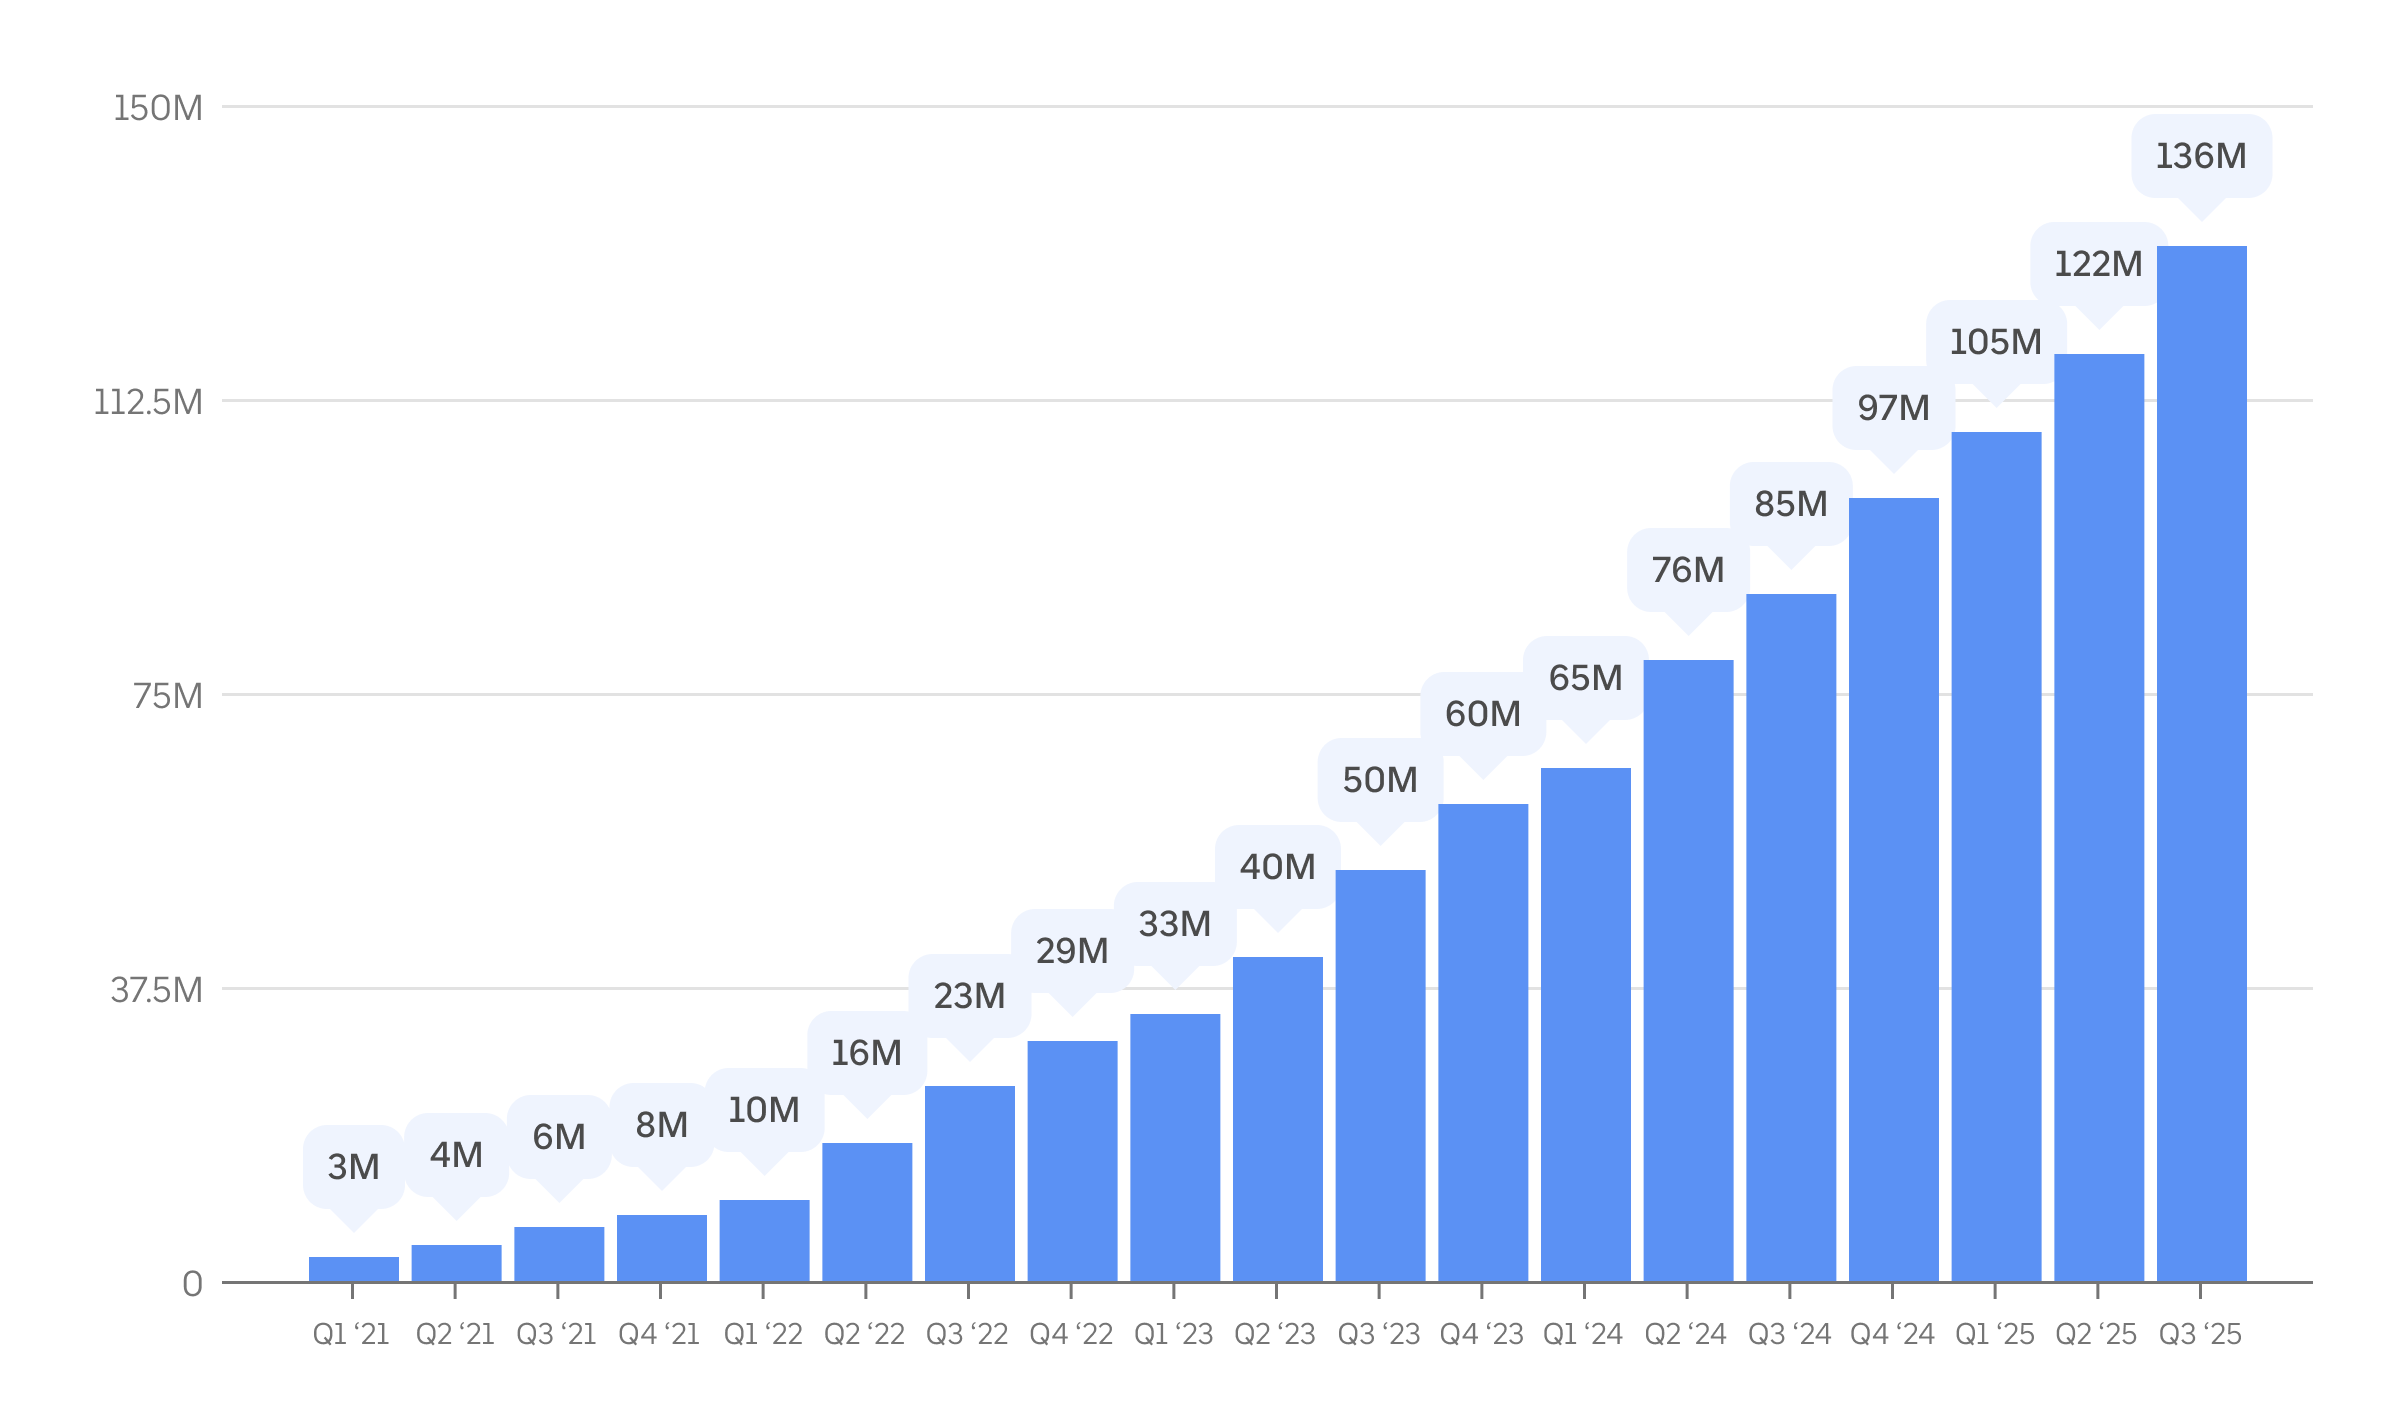
Μέτρηση: Αριθμός μετακινήσεων που κανονίστηκαν μέσω της εφαρμογής Uber και πραγματοποιήθηκαν από οδηγούς οχημάτων μηδενικών εκπομπών, ανά τρίμηνο από το πρώτο τρίμηνο του 2021.
Χρήση ZEV
In Q3 2025, ZEV drivers completed 16.8% of all on-trip miles in Europe and 9.5% of all on-trip miles in Canada and the US—adoption levels many times above drivers in the general public.
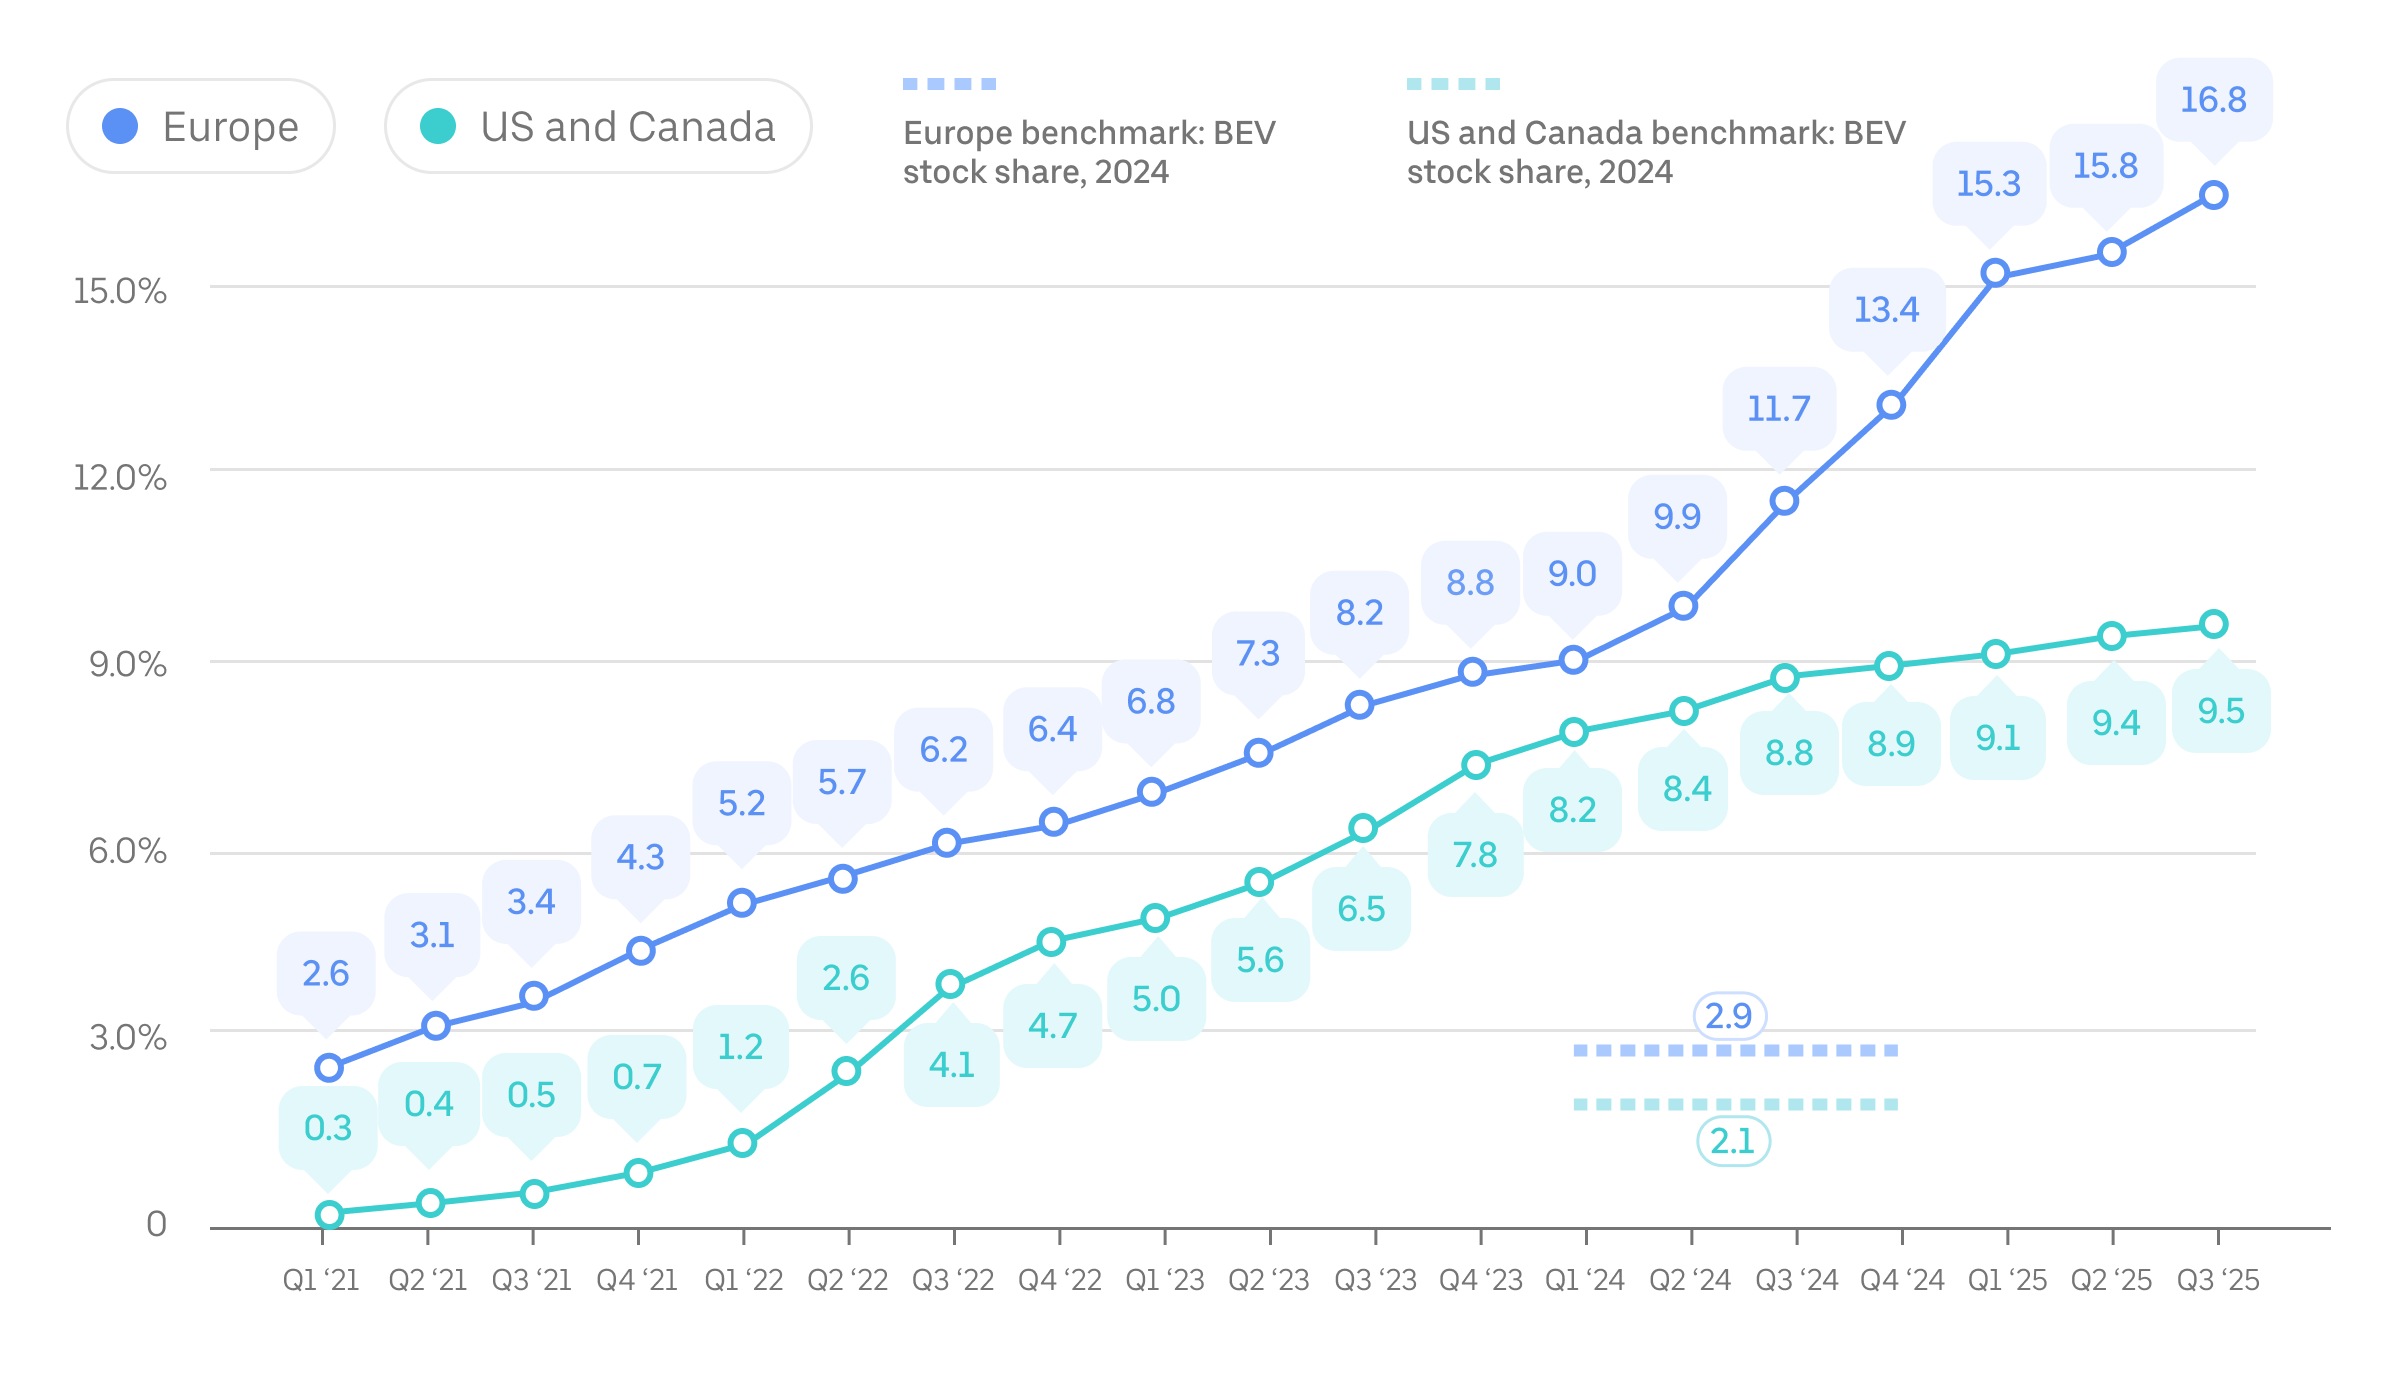
Metric: Share of on-trip miles completed in ZEVs compared with all on-trip miles arranged by the Uber app, by quarter since Q1 2021. Canada, US, and Europe benchmark data is as of 2024 (the most recently available at the time of this update) and is sourced from the International Energy Agency. “BEV” refers to battery electric vehicles.
Ένταση άνθρακα επιβατών
Το 2024, κάθε χιλιόμετρο που διένυε ένας επιβάτης με την Uber είχε ως αποτέλεσμα τη μέση παραγωγή 197 γραμμαρίων CO₂ στην Ευρώπη (ή 123 γραμμάρια CO₂ ανά χιλιόμετρο) και 340 γραμμάρια CO₂ στις ΗΠΑ και στον Καναδά (ή 212 γραμμάρια CO₂ ανά χιλιόμετρο). Σε σύγκριση με το 2021, αυτή η μέτρηση της έντασης άνθρακα για τους επιβάτες μειώθηκε σχεδόν κατά 14% στην Ευρώπη και κατά 6% στις ΗΠΑ και στον Καναδά.
Η ένταση άνθρακα για τους επιβάτες στην Ευρώπη, στις ΗΠΑ και στον Καναδά αυξήθηκε ελαφρώς μεταξύ 2023 και 2024 λόγω της μικρής μείωσης στη μέση πληρότητας των επιβατών και της αύξησης των «κενών δρομολογίων» (απόσταση που διανύθηκε πριν από και καθ' οδόν προς την παραλαβή επιβατών).
Metric: Passenger carbon intensity, or the estimated grams of CO₂ per passenger mile traveled, is an annual efficiency metric used by Uber—and, increasingly, governments and companies around the world. In the case of ridesharing, or any on-demand mobility service, emissions produced by any deadhead miles are factored into the calculation.
For more details about how we calculate passenger carbon intensity, go to our methodology document. Note that significantly lower average fuel economy for vehicles on Uber in Europe versus the US and Canada explains most of the difference in carbon intensity in these 2 geographies. While the composition of vehicles that drivers use on Uber’s app in Europe is more efficient (with a higher proportion of ZEVs and hybrids), more-stringent fuel economy reporting standards in the US also contributes to this discrepancy. In addition, we lack access to sufficient input data to calculate passenger carbon intensity for trips completed in European markets before 2021.
Πληροφορίες και ανάλυση
Say hello to Uber Electric (2025)
Electrifying ridehail in the US and Canada (2025)
EVs for everyone: balanced adoption of a maturing technology (2024)
Making sustainability the better choice (2024)
How to help spark electric mobility across Europe (2024)
Εξοικονόμηση εκπομπών με βιώσιμη μετακίνηση (2023)
Μέτρηση κινητικότητας για την ένταση άνθρακα (2019)
Συχνές ερωτήσεις
- Τι περιλαμβάνει η ενημέρωση της Uber για την ηλεκτροκίνηση;
Η ενημέρωσή μας για την ηλεκτροκίνηση παρέχει στα ενδιαφερόμενα μέρη μετρήσεις βάσει απόδοσης σχετικά με τις εκπομπές που σχετίζονται με τον άνθρακα και την ηλεκτροκίνηση για διαδρομές επιβατικών οχημάτων που πραγματοποιούνται μέσω της εφαρμογής Uber.
- Γιατί δημοσιεύετε αυτήν την ενημέρωση;
Αυτή η ενημέρωση, η οποία βασίζεται στην πραγματική χρήση της εφαρμογής μετακινήσεων, συμβάλλει στην παροχή μεγαλύτερης διαφάνειας για τον αντίκτυπο της ηλεκτροκίνησης και μας βοηθά να βελτιώσουμε τις προσπάθειές μας για την υποστήριξη της αποδοτικότητας στην εφαρμογή μας.
- Ποιες είναι οι βασικές μετρήσεις που χρησιμοποιείτε στην ενημέρωση για την ηλεκτροκίνηση;
Οι μετρήσεις περιλαμβάνουν τα εξής:
- Χρήση οχημάτων μηδενικών εκπομπών (ZEV) από τους οδηγούς της Uber (ποσοστό των μιλίων ή χιλιομέτρων κατά τη μετακίνηση με όχημα μηδενικών εκπομπών), το οποίο μετρά την πρόοδό μας προς τον στόχο μας για 100% κινητικότητα χωρίς εκ�πομπές ρύπων στην Uber παγκοσμίως έως το 2040
- Ένταση άνθρακα επιβατών , η οποία μετρά τις εκπομπές που προκύπτουν από κάθε επιβατικό μίλι
- Πώς θα βελτιώσει αυτή η ενημέρωση τη μείωση των εκπομπών και την υιοθέτηση της ηλεκτροκίνησης για τις διαδρομές με Uber;
Η φιλοδοξία μας είναι να μειώσουμε την ένταση άνθρακα των επιβατών στις μετακινήσεις και να αυξήσουμε τη χρήση οχημάτων μηδενικών ε�κπομπών στην Uber. Η μέτρηση και η διαφάνεια της προόδου αποτελούν σημαντικά βήματα στην πορεία μας.
- Οι επιβάτες πραγματοποιούν μετακινήσεις με την Uber αντί να χρησιμοποιούν επιλογές με λιγότερες εκπομπές άνθρακα, όπως η δημόσια συγκοινωνία;
Οι μετακινήσεις με την εφαρμογή Uber είναι μία από τις πολλές επιλογές μεταφοράς που έχουν στη διάθεσή τους όσοι αναζητούν μεταφορικό μέσο. Η επιλογή της μετακίνησης εξαρτάται σε μεγάλο βαθμό από τις διάφορες συνθήκες της τοπικής αγοράς. Η ανάλυσή μας τα δεδομένα της Εθνικής Έρευνας Ταξιδιών των Νοικοκυριών των ΗΠΑ δείχνει ότι η υψηλότερη χρήση των πιο βιώσιμων τρόπων μεταφοράς ανά νοικοκυριό (συγκοινωνία, περπάτημα και ποδήλατο) συσχετίζεται με υψηλότερη χρήση του επιμερισμού διαδρομών και άλλων λύσεων κατ' απαίτηση.
- Θα μετράτε τα ίδια δεδομένα για άλλες χώρες ή περιοχές σε όλο τον κόσμο;
Many of the above metrics now cover all passenger trips completed with the Uber app globally. We regularly report on carbon emissions and other impact areas resulting from trips on Uber.
- Με ποια συχνότητα αναμένετε να παρέχετε την ενημέρωση της Uber για την ηλεκτροκίνηση;
Ενημερώνουμε τις μετρήσεις τουλάχιστον σε ετήσια βάση και ενδέχεται να ενημερώνουμε ορισμένες μετρήσεις συχνότερα. Θα δημοσιεύουμε μετρήσεις εκπομπών (όπως την ένταση άνθρακα των επιβατών) σε ετήσια βάση, συγκεντρωτικά ανά ημερολογιακό έτος.
- Τι εννοείτε με τον όρο «όχημα μηδενικών εκπομπών»;
We use the term “zero-emission vehicle” (ZEV) the same way the California Air Resources Board (CARB) and Europe’s Transport & Environment (T&E) do: to refer to vehicles that produce no direct CO₂ emissions or other criteria air pollutants (such as NOx, particulate matter, CO₂, and SOx) from the on-board source of power. Regional variations should be considered at the reader’s discretion.
Drivers using Uber’s app use 2 types of ZEVs today: battery electric vehicles (battery EVs) and, very occasionally, hydrogen-powered fuel cell electric vehicles (FCEVs).
Of course, the “zero” in ZEV refers to no emissions from the proverbial “tailpipe” of the vehicle and not necessarily all the emissions that can be accounted for from production to disposal of the vehicle and its energy source. All accounted for, however, life-cycle analyses by independent experts show that “emissions over the lifetime of average medium-size battery EVs registered today are already lower than comparable gasoline cars by 66%–69% in Europe, 60%–68% in the United States, 37%–45% in China, and 19%–34% in India.”
- Θα μετρήσετε τον αντίκτυπο για την επιχείρηση παράδοσης που διαθέτετε;
Our Electrification Update currently covers electrification and emissions metrics only for our Mobility business (ridesharing). We aim to include our progress on delivery emissions and electrification in the future.
In terms of packaging, Uber continues to invest in helping merchants transition to sustainable options. As with electrification, however, progress depends on collective action. We’re prioritizing efforts in cities where public and private investments are aligned. For example, in France over 60% of packaging used on the platform is recyclable, reusable, or compostable, supported by national policy and local incentives.
While progress has been made, based on current trends we cannot meet all 2025 goals, and our 2030 goals will be out of reach without stronger, coordinated action across government and industry.
While many key levers are outside our control, we remain deeply committed to this transition. To learn more about Uber’s approach to more-sustainable packaging with merchants, consult our Uber Eats for Merchants web page.
- Αποκαλύπτει η Uber τις εκπομπές του Πεδίου 1, 2 και 3 και, εάν ναι, πού εντοπίζονται;
Uber discloses Scope 1, 2, and 3 emissions in our Governance Strategy and Engagement Report and to CDP. You can find our most recent score in CDP’s public corporate score search. These emissions estimates have received limited assurance from an independent third party.
This page and the related information, updates, reports, and web pages (the “Report”) contain forward-looking statements regarding our future business expectations and goals, which involve risks and uncertainties. Actual results may differ materially from the results anticipated. Additionally, this Report is provided for informational purposes only and should not be relied upon for business or vehicle acquisition decisions. Undue reliance should not be placed on the forward-looking statements. We undertake no duty to update this information unless required by law. For more information on Uber’s strategy, please go to investor.uber.com.
Certain data disclosed in this Report has received limited assurance from LRQA. Data discrepancies with assurance may be present due to rounding methodologies.
The use of terms in this Report such as “drivers,” “couriers,” “earn,” “zero- emission vehicle,” and “sustainable packaging” are general and follow the general use case of the words by Uber Technologies, Inc. Regional variations of words should be considered at the reader’s discretion.
An overview of Uber's use of carbon offsets can be found here.
Σχετικές πληροφορίες
Σχετικές πληροφορίες