
Every day, millions of people rely on Uber to move from place to place and have food and groceries delivered. Uber depends on the reliability of its internal systems and the accuracy of data to power its platform. A glitch in its systems can result in a poor user experience and/or a loss in revenue. Major system issues that affect the reliability of our services are detected and mitigated quickly. However, there are several minor issues that take a longer time to detect and mitigate. Such minor issues can collectively result in poor user experiences and revenue loss over time. This is where uVitals comes in, as it surfaces these issues and anomalies when they begin to occur.
Motivation
In today’s fast-paced digital world, where businesses depend on uninterrupted services, preventing downtime and disruptions is crucial.

Let’s take a look at the distribution of outages, where the x-axis represents the time it takes to detect an issue in hours and the y-axis depicts the frequency of failures. What we observe is interesting: issues with higher failure frequencies tend to be detected earlier and resolved within a day, thanks to our reliability and availability systems.
However, the story takes a different turn when we explore the domain of less frequent issues. Here, the time to detection stretches, often surpassing a day, as these challenges are typically handled through incident response processes. But what about the long tail of issues that lurk in the shadows, sometimes remaining undetected until they cause chaos? For these, traditional strategies may not suffice.
This is where uVitals steps onto the stage, ready to seize the opportunity to detect sooner and detect more.
Introduction
So, what is uVitals?
- uVitals is an Anomaly Detection and Alerting system
- It specializes in detecting anomalies in multi-dimensional time series data sets
- It works unsupervised
Now, let’s take a look at a few scenarios where uVitals truly shine in anomaly detection.
Example 1: Performance Metric Monitor
Let’s say uVitals is monitoring a performance metric that spans across all airports where Uber operates. This monitor should alert the team when the airport trips have an issue. uVitals continuously monitors the performance metric for all airports and alerts the team as soon as an anomaly occurs for any of the airports. The team will get alerted with a chart like the one below where they can see the spike in the performance metric along with contextual information that will help the team to identify the root cause.
Performance Metric Monitor

Example 2: Success Rate Monitor
Let’s say uVitals is monitoring a success rate metric for the payment system. This involves monitoring several million combinations across several payment attributes. There are payment issues that could affect a particular region or country as a whole or there may be issues that affect a particular bank in a small city. Challenge is to detect the issue regardless of the size.
uVitals strength is to monitor the success rate at all levels. Regardless of the size, it will be able to accurately detect the drop in the success rate and alert the team about the issue along with the contextual information that will help the team to identify the root cause. The team will get alerted with a chart like the one below where they will be able to see the sudden drop in the success rate along with the attributes that are affected by the drop.
Success Rate Monitor

Key Features

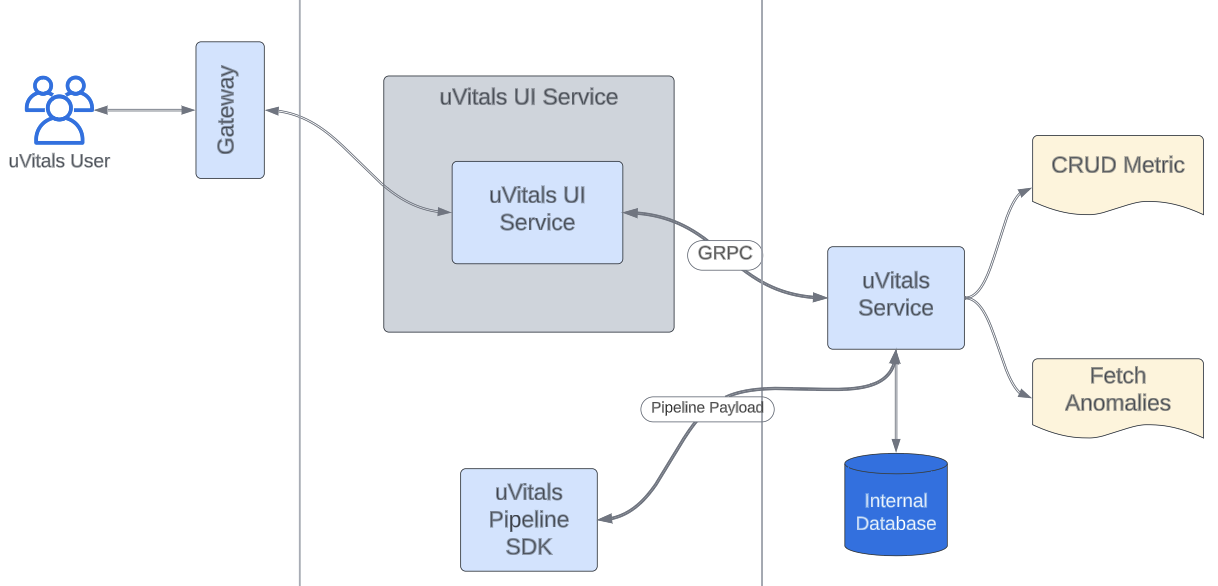
System Overview

- Onboarding: This facet allows users to effortlessly onboard metrics, whether through the user-friendly UI or the convenience of APIs.
- Anomaly Detection: At the heart of uVitals lies a robust anomaly detection module, detecting anomalies as they occur. When an anomaly is identified, the system promptly logs it into the anomalies database, ensuring traceability and data integrity.
- Alerting: To enable timely responses, uVitals employs various alerting mechanisms, including email and other popular means.
- Feedback Loop: User feedback enhances uVitals’ learning capability, helping generate exception rules to refine and improve anomaly detection, ensuring greater efficiency over time.
Architecture

Onboarder: This is where users bring in their metrics and initiate their anomaly detection journey.
Metric Cube Creator: It assembles a multi-dimensional metric cube, encompassing various data slices used for anomaly tracking.
Profiler: Data passes through the profiler, which identifies data irregularities like gaps or spikes.
Seasonality Detector: Data then undergoes seasonality detection, examining every data slice for seasonality patterns.
Toolkit: Based on seasonality signals, appropriate models are applied to individual data slices.
Rules Engine: The rules engine consolidates model signals, applies generic rules, and detects anomalies.
Significance Scorer: Anomalies are ranked by significance using the significance scorer.
Publisher: These anomalies are routed to the publisher, where user-defined contextual filters are applied.
Notifier: Anomalies flagged by the publisher are sent to users through the notifier component.
Feedback Listener: Users can provide feedback on anomaly accuracy, collected and stored in the feedback repository.
Feedback Processing and Learning: The feedback processing and learning system uses feedback to generate exception rules, refining anomaly detection.
Quality Controller: The system continuously measures performance, ensuring it’s self-improving and self-healing.
Model Selection Process

In the world of anomaly detection, selecting the right model to detect anomalies is paramount. uVitals follows a meticulous model selection process to enable the highest accuracy and efficiency in identifying deviations from the norm.
- Understanding Data Patterns: uVitals begins by comprehensively analyzing data patterns to recognize anomalies effectively.
- Data Profiling: Thorough data profiling reveals data distribution, dimensions, and potential irregularities.
- Labeling Data Sets: Labeled data sets are created to train models effectively and learn from historical anomalies.
- Calibrating Precision and Recall: uVitals fine-tunes precision and recall metrics to balance anomaly detection accuracy.
- Measuring F1 Score: The F1 score, a harmonic mean of precision and recall, is measured to assess model performance comprehensively.
- Regression Analysis: Regression analysis enhances model performance by analyzing variable relationships.
- Deployment: The selected model is deployed into the production environment for anomaly detection.
- Continuous Measurement and Monitoring
- Periodic data labeling to keep models up-to-date with new anomalies.
- Continuous performance monitoring with precision, recall, and F1 score metrics. Adjust hyperparameters for enhanced accuracy if needed
- Seamlessly adapt to better-performing models for top-notch efficiency and accuracy.
Model Selection and Execution in Real Time
uVitals thrives in anomaly detection through dynamic processes. Its seasonality detector discerns patterns as seasonal or nonseasonal, which promotes swift model selection. With real-time profiling and pattern extraction, uVitals adapts to evolving data. The model recommendation engine evolves based on real-time insights, continually updating model metadata. It achieves automated real-time model selection for every time series.
Seasonality & Non-seasonality Models Comparison
In this journey, we evaluated models like Statsmodels® STL (Seasonal and Trend decomposition using Loess), Meta Prophet®, and seasonal decomposition models across a spectrum of data sets, encompassing both seasonal and non-seasonal data patterns.
The following chart presents a concise overview of the recall, precision, and F1 score achieved by each model:
| Dataset | Charge success rate(Seasonal) | Disbursement success rate (Non – Seasonal) | Amount Redeem (USD) (Seasonal) | ||||||
| Model Name | Recall | Precision | F1 score | Recall | Precision | F1 score | Recall | Precision | F1 score |
| Seasonal decompose | 0.33 | 0.43 | 0.38 | 0.56 | 0.28 | 0.37 | 0.56 | 0.29 | 0.38 |
| STL | 0.33 | 0.75 | 0.46 | 0.67 | 0.67 | 0.67 | 0.88 | 0.52 | 0.65 |
| Prophet® | 0.67 | 0.60 | 0.63 | 0.33 | 1.00 | 0.50 | 0.94 | 0.68 | 0.79 |
Prophet® and STL models outperform others based on their F1 score. While Prophet® delivers excellent results for datasets featuring seasonality, it occasionally fits a non-essential seasonal pattern in non-seasonal datasets. With uVitals’ unsupervised capabilities and its adaptability to multi-dimensional time series data with diverse patterns, STL emerges as the optimal choice for precise anomaly detection.
Multi-Seasonality Model Evaluation
STL models might not seamlessly handle multi-seasonal data, such as hourly time series with multiple seasonality patterns like daily and weekly fluctuations. To provide precise hourly granularity anomaly detection, we evaluated several decomposition models.
| Approach | RMSE | MAPE |
| Single decomposition | 1841 | 18.81% |
| Multiple decomposition | 458 | 4.58% |
| Hourly model | 636 | 20.09% |
| Prophet® forecast | 1487 | 30.78% |
Seasonality Detector Model Assessment
The chart below illustrates the evaluation of various models, highlighting their precision, recall, and other key metrics in the context of the seasonality detector.
| Method | Error rate | Precision | Recall | F1 score |
| Based on the Autocorrelation strength | 15.74% | 1.00 | 0.55 | 0.71 |
| ACF on detrended time series | 9.14% | 0.90 | 0.83 | 0.86 |
| ACF on detrended time series & statistical significant correlation | 58.38% | 0.37 | 0.94 | 0.53 |
| Based on strength of seasonality | 55.84% | 0.31 | 0.48 | 0.38 |
| Kruskal-Wallis test | 79.19% | 0.12 | 0.19 | 0.14 |
| Ensemble ACF on detrended time series with 95% CI | 10.66% | 0.90 | 0.78 | 0.84 |
| Fast Fourier transformer(FFT) with specific seasonal periods | 8.63% | 0.88 | 0.83 | 0.85 |
Other Supported Models
uVitals supports other models, including:
| IQR (Interquartile Range) | Special events exclusion |
| Standard deviation | NVD (New Value Detection) |
| Moving averages using sliding window(Simple Moving Average, Exponentially Weighted Moving Average) | UDM (User Defined Model) |
| Two proportion test | Data Classification Model |
Backend Services
The web services empower seamless interaction with the uVitals Anomaly Detection System. Built using the Go programming language, the web services provide an interface for managing metrics configurations and viewing anomalies efficiently.
Metric API
In our backend services, we provide a streamlined approach to managing metric configurations. Through the CRUD operations (Create, Read, Update, Delete), users can efficiently onboard new metrics, explore settings, fine-tune configurations in real time, and remove unwanted metrics.
Anomalies API
The core of the system, the “Anomalies” API, provides a comprehensive list of anomalies for a given metric and date range. This feature offers crucial insights into unusual data patterns, enabling users to take prompt action.
UI
uVitals’ User Friendly Interface empowers users with seamless navigation and self-serve capabilities. The landing page is where all your metrics are neatly organized. With just a few clicks, you can effortlessly view, edit, clone, and onboard new metrics.
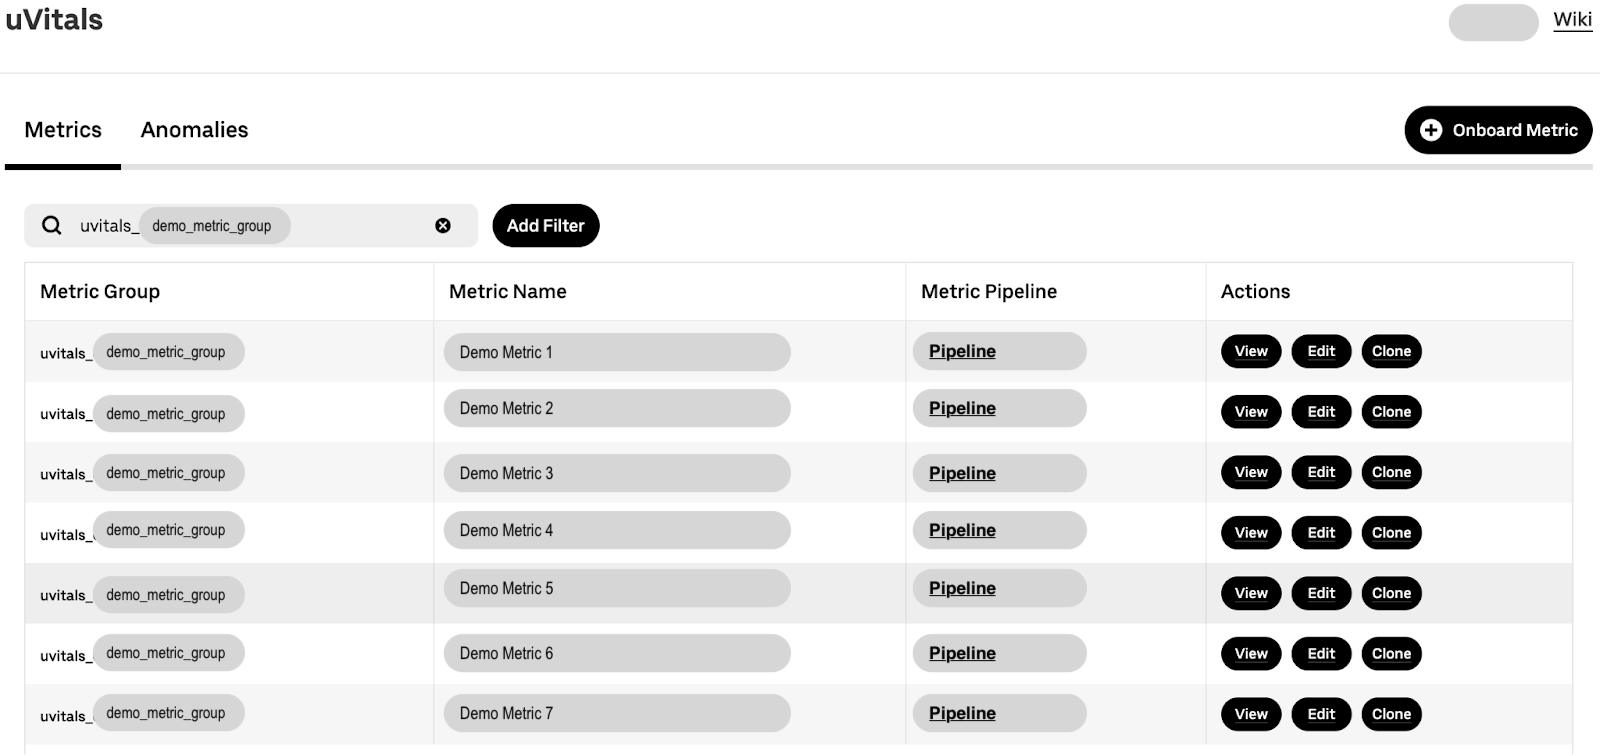
In the Anomalies tab, you get a comprehensive view of all detected anomalies.
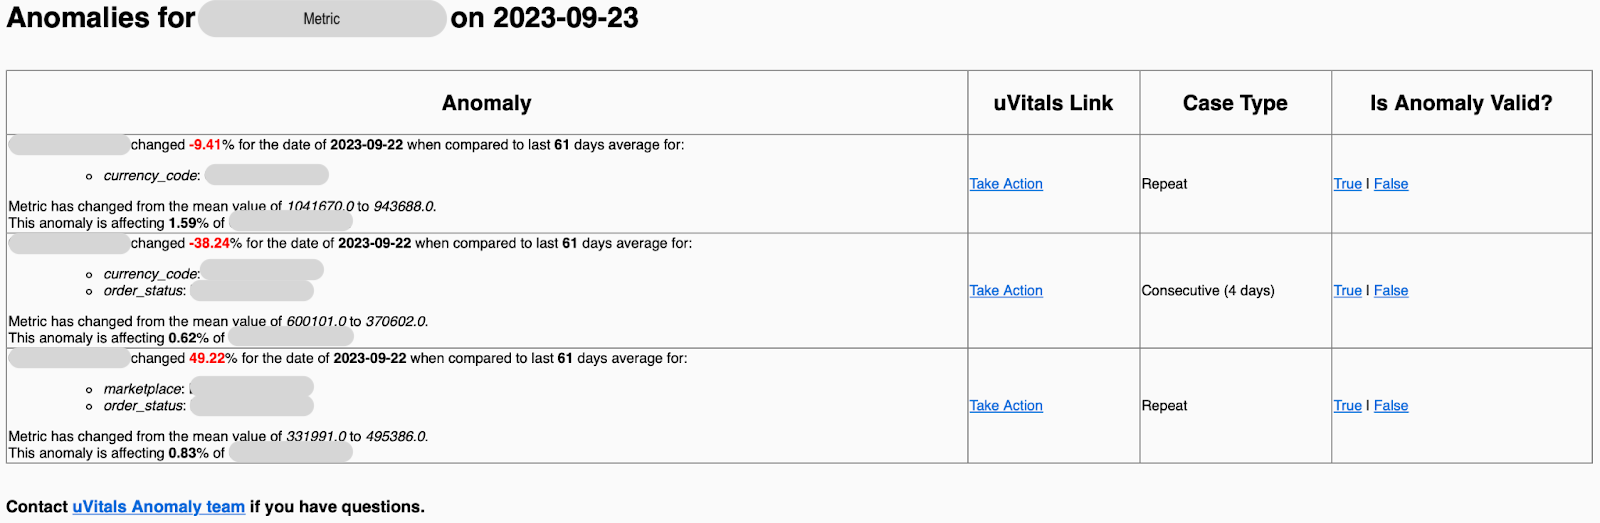
Let’s take a closer look at one metric, the Demo Metric 1. This metric tracks performance across four different dimensions: products, currency_code, order_status, and error_type. This helps keep an eye on the overall product health.
Now, let’s dive into a specific anomaly that unfolded on September 23rd. uVitals detects anomalies at any granularity. In this particular case, the anomaly is unique to currency_code XYZ and order_status ZZZ. Orders seem to be stalling in the ZZZ state for XYZ.
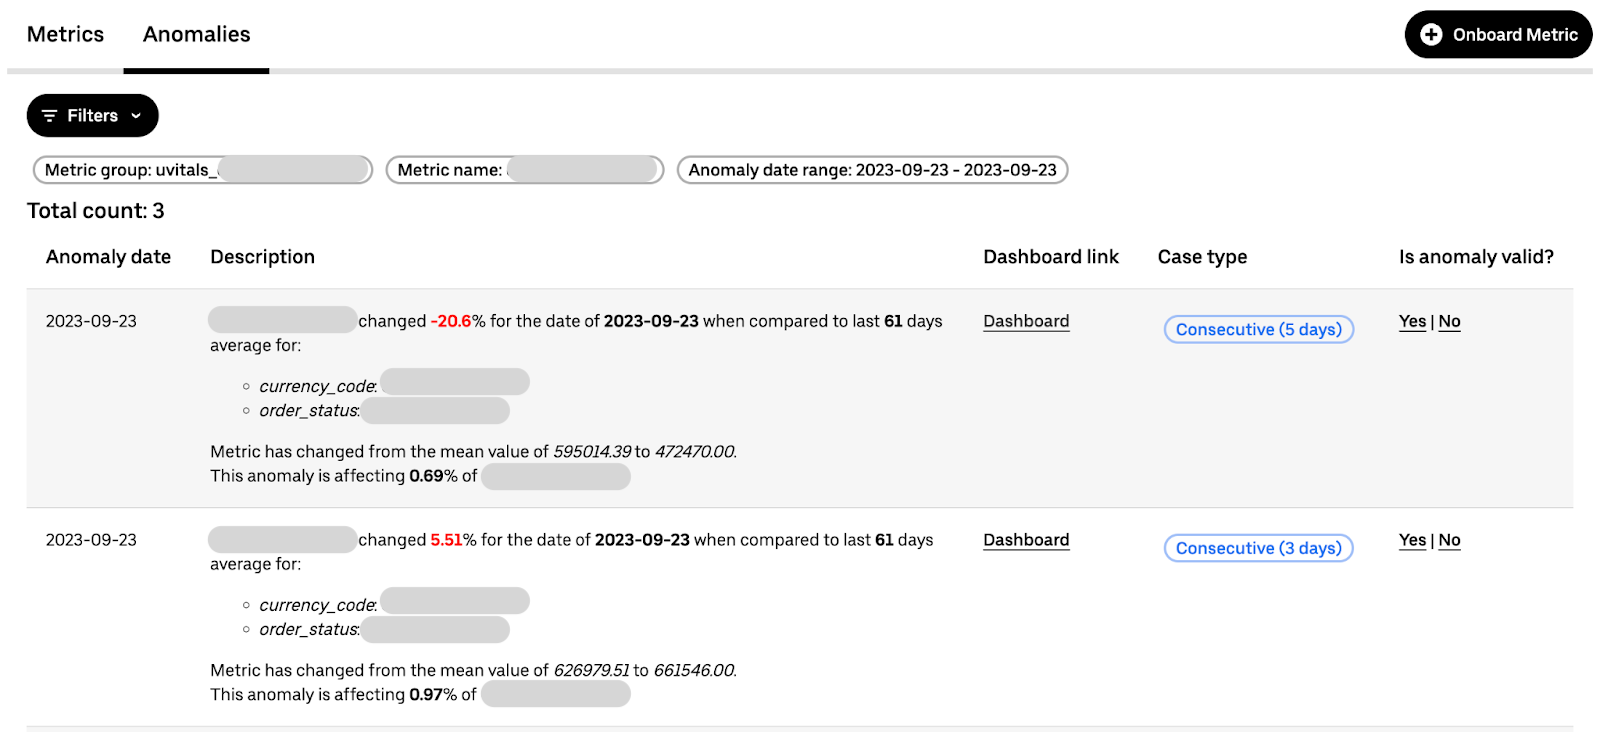
What’s more, uVitals doesn’t just detect anomalies; it helps you understand them. The metric deviated by -20.6% from its mean, signaling a significant drop. Its contribution percentage, a substantial 0.69%, underscores its importance.
To go even deeper, you have the dashboard link at your disposal. To explore the finer details and uncover the root causes, delve into the dashboard section.
Dashboard
Continuing our analysis of the anomaly we uncovered earlier, the top charts provide a comprehensive time-series visualization of the metric’s behavior. Here, you’ll gain insights into its patterns, trends, and observations derived from various models.
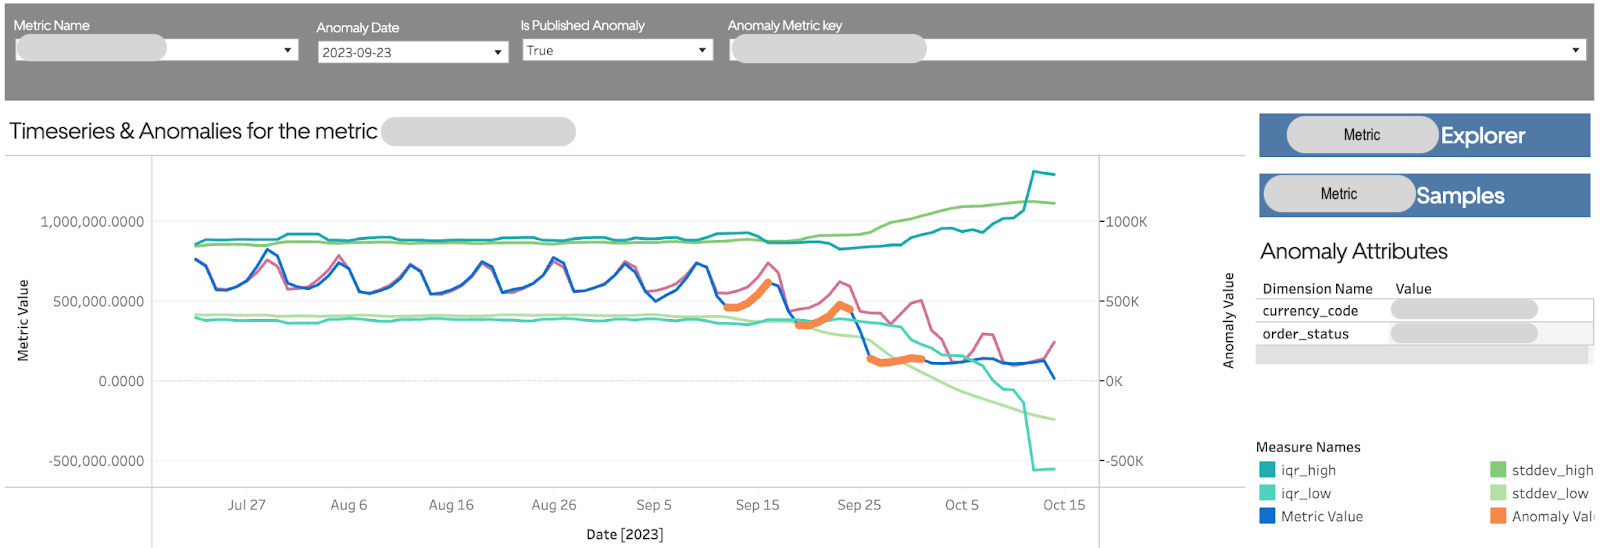
We observe a downward trend in the metric, and to uncover the “why.” We explore drill-down charts for different dimensions, providing us with additional context.
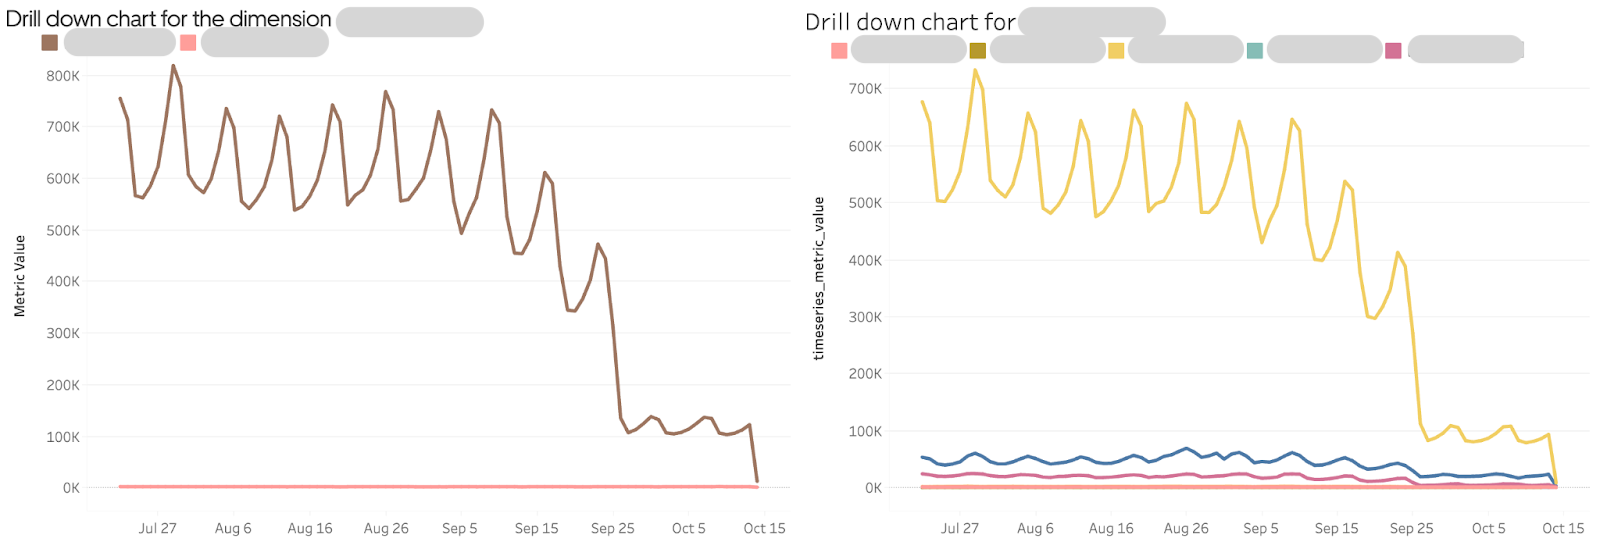
The ABC product and CriticalERROR error type align perfectly with the top chart’s trend. explaining the root cause behind the metric’s decline.
For those seeking deeper insights, additional dimensions are available. Moreover, a sample of 100 related orders is provided for a comprehensive analysis, enabling users to identify the issue’s core and take actions to resolve it.
Alerting
uVitals delivers timely anomaly notifications directly to users’ inboxes, prioritizing them based on significance. These notifications include crucial information such as the anomaly date and concise, informative descriptions. Users can assess the anomaly’s impact with precision using the mean difference percentage and understand its significance in the dataset through the contribution percentage. Additionally, a direct dashboard link empowers users to explore the data visually for a comprehensive understanding.
uVitals categorizes anomalies as new, ongoing, or consecutive, aiding users in identifying emerging issues, persisting anomalies, and consistent trends. Furthermore, user feedback is essential, and each notification includes a feedback link, allowing users to contribute insights on the anomaly’s nature, whether it’s a true positive or a false positive. This feedback loop plays a pivotal role in refining the system’s accuracy over time. With audience targeting features, uVitals provides customized alerting based on the affected data, enabling timely notifications to the right groups.
Managing False Positives
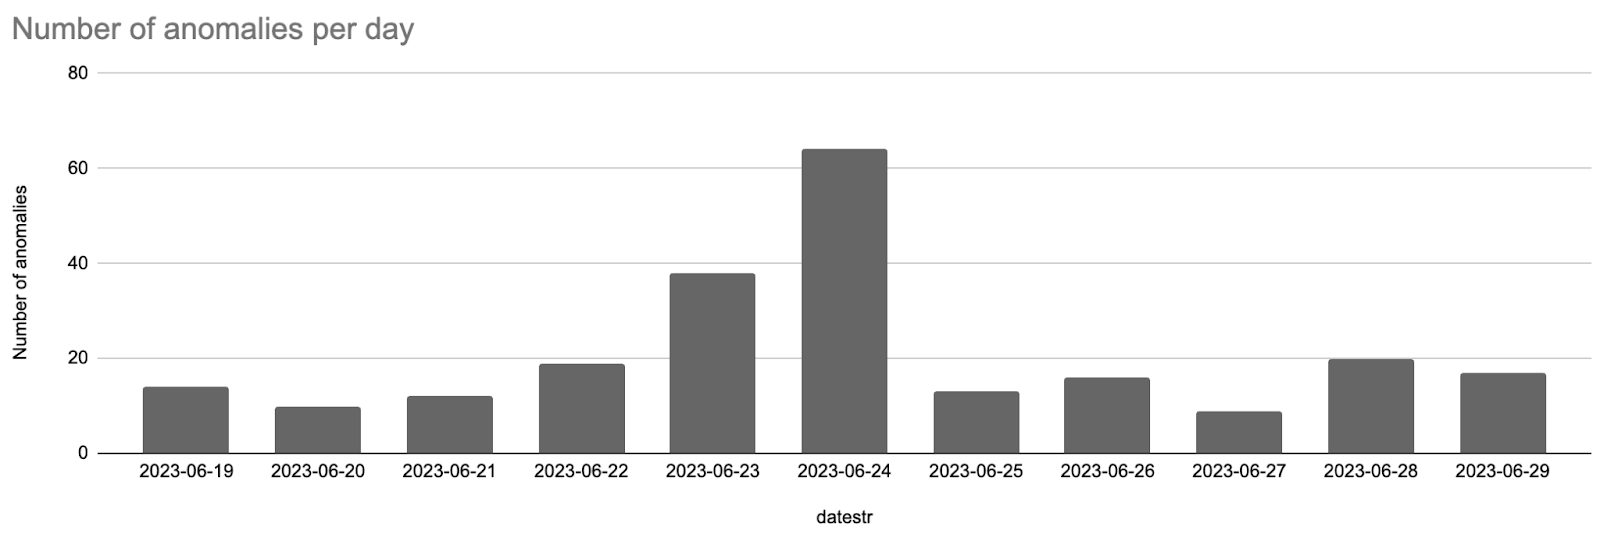
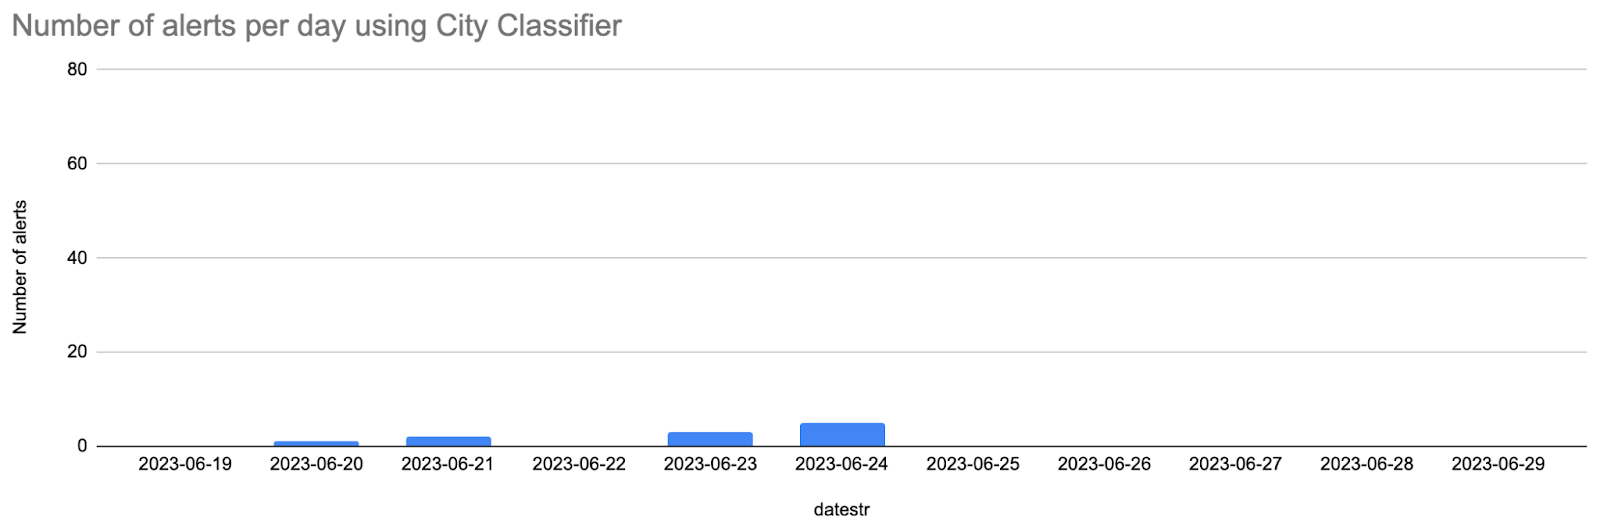
Managing false positives in the world of anomaly detection is an age-old challenge. In our particular case, we aimed to monitor gross bookings for 2,000 cities. Within the first 10 days, we encountered 232 anomalies, as depicted in the below chart:
But on closer examination, we found that 95% of these anomalies were mere noise, leaving us with only 11 genuine anomalies, as shown in the below chart:
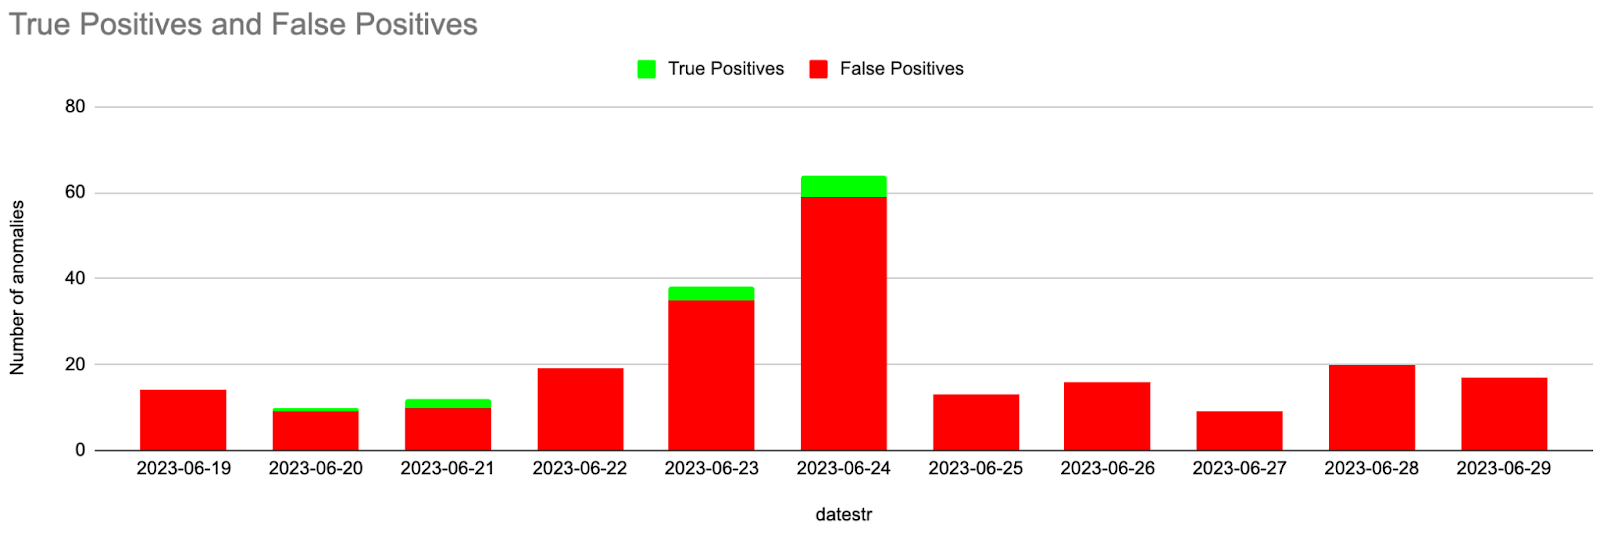
Upon further investigation, we discovered that the noise was primarily coming from cities with traffic, as shown in the below chart. Although these alerts seemed legitimate, they weren’t actionable by the business. To tackle this, we focused on reducing the noise coming from low traffic cities.
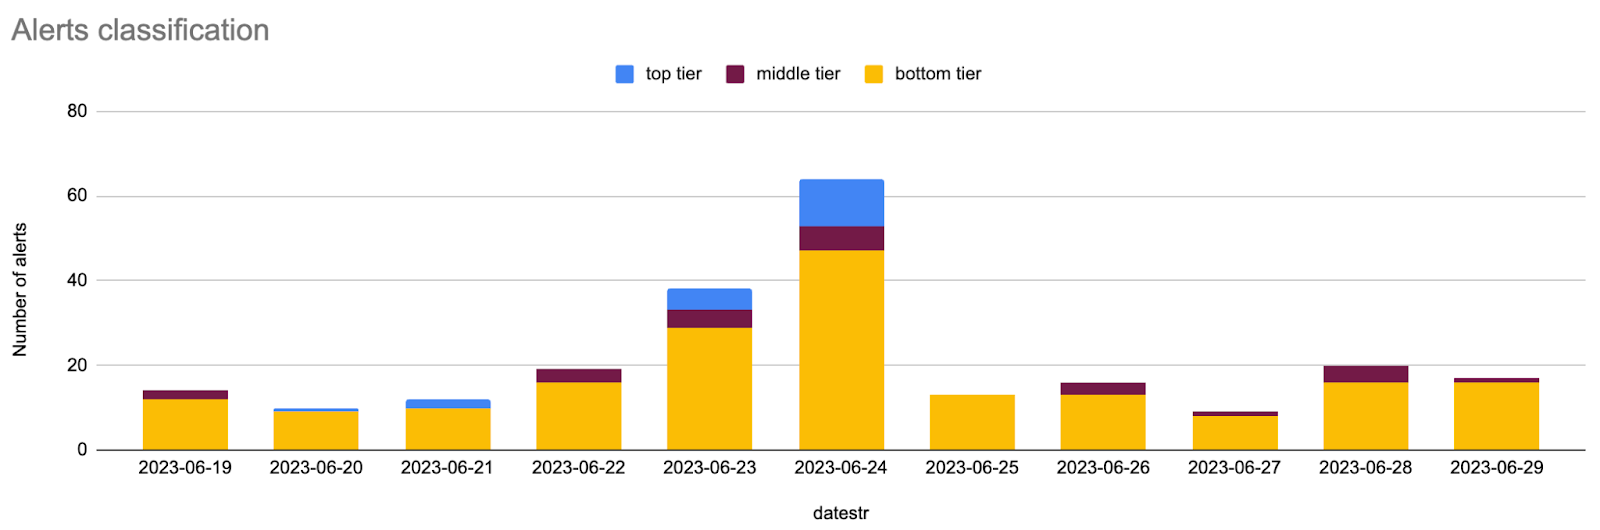
We implemented City Classifier that classifies the cities into top, middle, and bottom tiers based on the traffic. The city classifier was then applied in uVitals. This allowed us to reduce the anomalies from 232 down to just 11, which is a 100% noise reduction, as shown in the below chart:
Process Efficiency
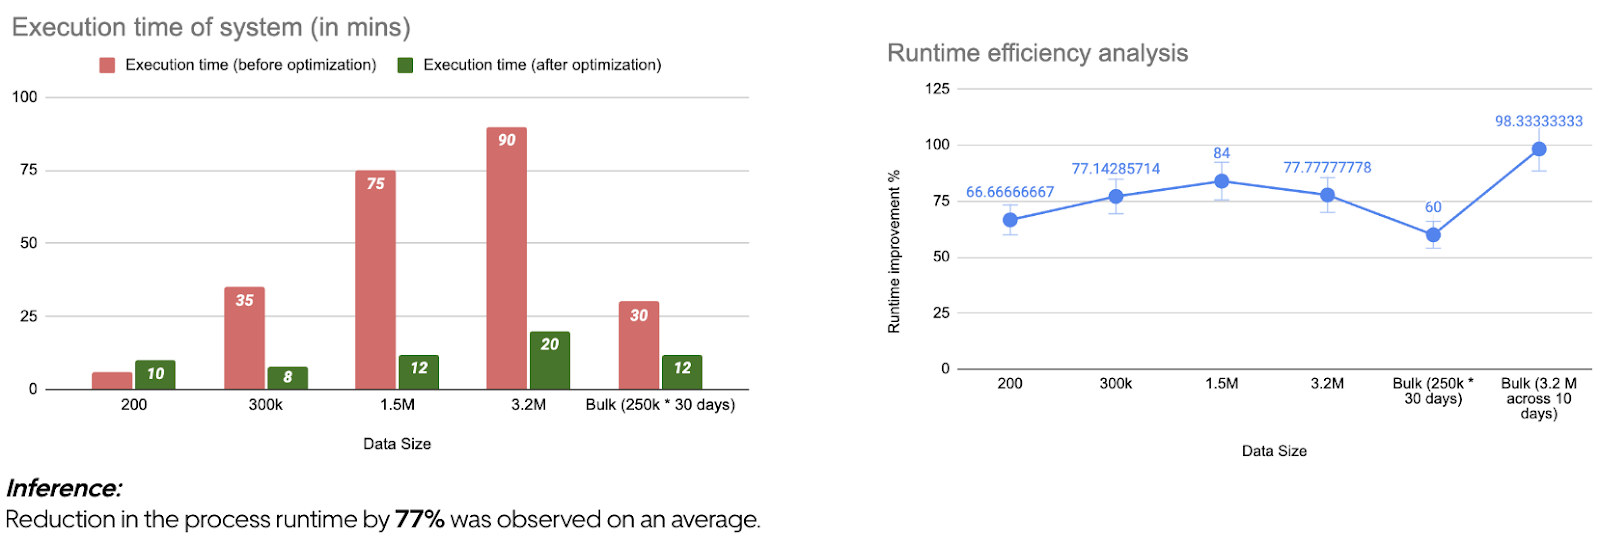
Our goal was to evaluate the system’s performance across various data sizes, ensuring it could seamlessly handle up to 3 million time series data points. A chart tells the story of “before” and “after” optimizations, showcasing not only the timing differences, but also the remarkable improvement in runtime efficiency–an average reduction of 77%. The key to this performance boost was a strategic shift from utilizing Pandas® to harnessing the power of Apache Spark®. This transformation empowered our system to process vast volumes of data swiftly and with efficiency.
The Future of uVitals
As technology and data continue to evolve, so does the journey of uVitals. We have exciting plans for the tool’s future, designed to further enhance its capabilities and adapt to the ever-changing landscape of anomaly detection. Here are some key directions we’re exploring:
- AI-driven insights
Harnessing the capabilities of AI to provide users with rich, context-aware content during alerting.
- Real-time anomaly detection & offline model
Real-time insights are crucial in today’s fast-paced world. We’re working on enhancing uVitals to provide even faster anomaly detection, enabling users to respond to emerging issues as they happen. This initiative involves training the model and maintaining its results for availability in real-time anomaly detection scenarios.
Conclusion
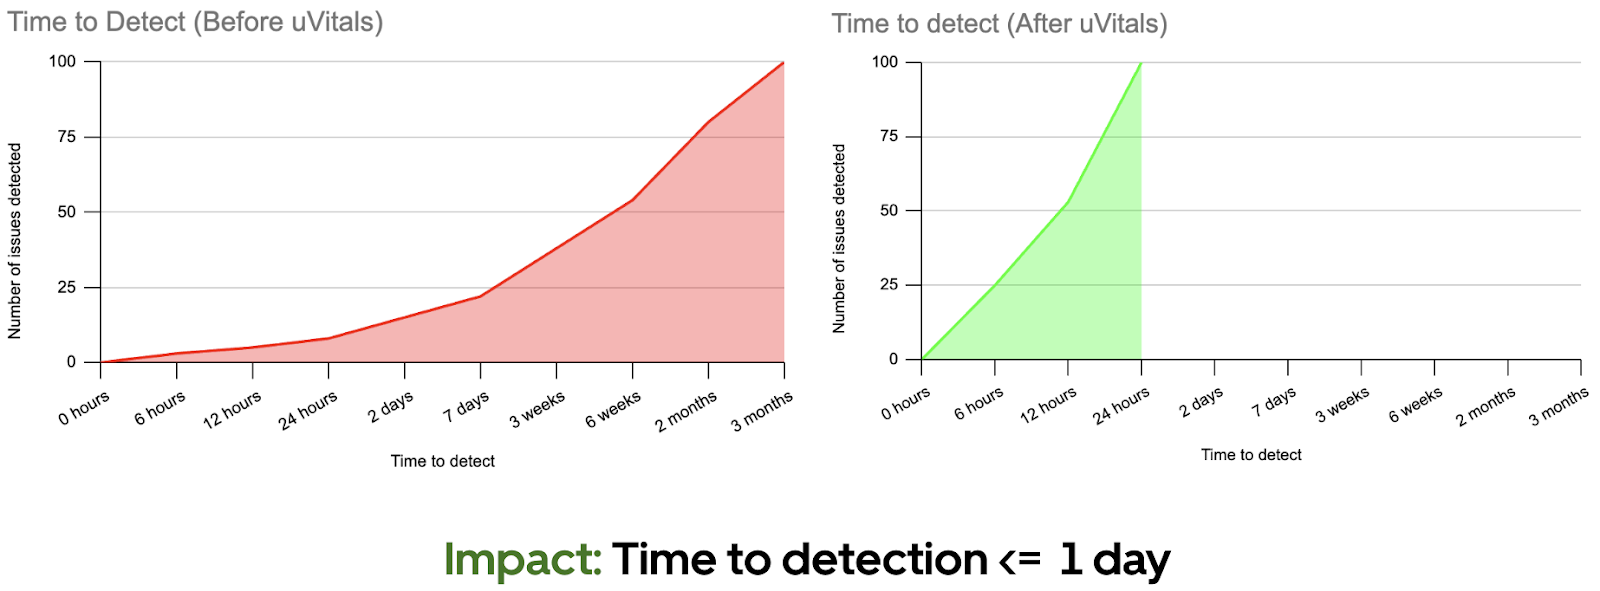
In a nutshell, uVitals has transformed the anomaly detection speed. Before uVitals, it would take a staggering 3 months to detect 100 issues. But with uVitals, it is brought down to one day or less. This means that we are more efficient, reliable, and proactive.
With uVitals, we are ready for tomorrow’s challenges.
Apache®, Apache Pinot™, Apache Hadoop®, Apache Spark®, Apache Kafka®, Apache Flink®, Apache Hive™, Pinot™, Hadoop®, Kafka®, Flink®, and Hive™ are either registered trademarks or trademarks of the Apache Software Foundation in the United States and/or other countries. No endorsement by The Apache Software Foundation is implied by the use of these marks.
Statsmodels is the trademark of Seabold, Skipper, and Josef Perktold. “statsmodels: Econometric and statistical modeling with python.”
Proceedings of the 9th Python in Science Conference. 2010; Pandas® is an open source BSD-licensed library by NumFOCUS Inc.
Prophet® is an open source software by Meta Inc.
Presto® is an open source project of Presto Foundation
Main image attribution: “Think different” by torremountain is licensed under CC BY 2.0.

Venki Appiah
Venki Appiah is the Senior Staff Engineer and the Tech Lead for uVitals, and plays a crucial role in driving uVitals' development and innovation. In his free time, he volunteers for non-profit organizations and enjoys practicing meditation.

Komal Raulkar
Komal Raulkar is a Senior Data Engineer who serves as our UI Engineer for uVitals, contributing to the user-friendly interface, and as a Framework Builder, improving system efficiency. In her free time, she enjoys practicing yoga and playing badminton.
Posted by Venki Appiah, Komal Raulkar
Related articles

How LedgerStore Supports Trillions of Indexes at Uber
4 April / Global


Most popular

Ensuring Precision and Integrity: A Deep Dive into Uber’s Accounting Data Testing Strategies

DragonCrawl: Generative AI for High-Quality Mobile Testing

DataCentral: Uber’s Big Data Observability and Chargeback Platform

Jupiter: Config Driven Adtech Batch Ingestion Platform
Products
Company
