Forecasting Models to Improve Driver Availability at Airports
19 August 2025 / Global
Introduction
Airports are a cornerstone of Uber’s ridesharing ecosystem, accounting for 15% of global mobility gross bookings. These airport trips present unique operational challenges that set them apart from trips in the rest of the city.
Unlike city trips, airport operations have a distinct workflow and set of logistics:
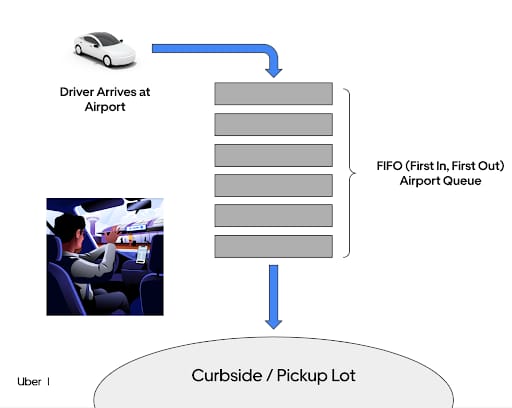
- Arrival at the airport. Drivers enter the airport and join a First-In-First-Out (FIFO) queue — typically located on or near airport property — in order to receive ride requests.
- Waiting in the queue. Drivers often have to wait for their turn to receive a trip offer in a queue, whereas city trips are not queue-dependent.
- Navigating pickup logistics. Drivers must navigate to designated pickup locations specific to each airport. Riders unfamiliar with airport layouts may face difficulties finding these areas.
Airport operations introduce additional layers of complexity, like:
- Re-match opportunities. Drivers dropping off riders at airports may be re-matched with incoming passengers shortly after completing the dropoff.
- Priority for short trips. Drivers completing short trips to nearby locations are often placed in a priority queue upon returning to the airport.
- Multiple queues. Airports typically maintain separate queues based on vehicle types (like UberX, Uber Black), each with unique demand dynamics.
- Demand cycles. Demand surges occur sporadically, often aligned with flight landings or delays, making planning difficult.
- Driver behavior. Some drivers may be very selective in accepting offers once they reach the front of the FIFO queue, to make up for lost time waiting in the queue.
- Regulatory constraints. Airports enforce strict rules about where drivers can wait, when pickups are allowed, and how long riders can linger in designated zones.
- Driver eligibility. Not all drivers are eligible for airport trips, and some drivers specialize exclusively in airport pickups.

From a driver’s perspective, airport trips often require making different decisions than city trips. They may ask questions like:
- Will demand and earnings at the airport be higher than in the city?
- Is the wait time in the queue worth the potential earnings?
- Should I drive to the airport without a guaranteed trip?
- Is navigating the airport pickup process too time-consuming or frustrating?
- Is it worth arriving during off-peak hours, such as early mornings, when flights land?
Given these factors, airport trips require careful consideration and strategy, often posing a more complex experience for drivers than city trips. As a result, many of Uber’s typical city marketplace models and algorithms are no longer applicable at airports, requiring novel solutions more tailored to airport dynamics.
In this blog post, we discuss a set of airport-specific models developed to address these challenges, providing actionable insights to drivers and optimizing airport operations to create a more seamless and rewarding experience.
Background
Airports are highly dynamic environments, with unpredictable demand surges tied to irregular flight schedules, holidays, and weather events. This volatility led to frequent mismatches in driver availability and demand, with an excess of drivers during lulls or a lack of drivers during peak periods.
In over-availability scenarios at airports, drivers entering airport FIFO queues often waited a long time before receiving a trip offer, with no guarantee that the trip would justify the wait. This led to dissatisfaction and incentivized suboptimal behaviors like cherry-picking, where a driver who reached the front of the queue continuously rejected trips that they deemed to be too low-value to make up for the cost of their time waiting in the queue.
In under-availability scenarios at airports, riders experienced significant frustration from increased spinner times (the time it takes for their trip to be accepted by a driver) and higher trip cancellation rates. This significantly degrades the rider experience and makes them less likely to view Uber as a reliable option in the future.
In light of these challenges, we developed a suite of airport forecasting models, which predict real-time indicators of airport marketplace conditions over the next hour. These models power product features, which fall into two categories: informational products and internal product features.
Informational products surface expected airport marketplace conditions to drivers. This incentivizes drivers to come to the airport during times of expected underavailability, while encouraging them to stay in the city during times of expected overavailability.
Internal product features trigger backend flows to proactively correct imbalances. For example, summoning drivers to the airport during times of expected underavailability, or adjusting airport trip matching parameters based on marketplace condition.
The Uber Airports product contains multiple models, which power various features falling into these categories. In this blog post, we focus primarily on three different Airports forecasting models as representative examples:
- ETR (Estimated Time to Request): Predicts how long a driver in the FIFO queue waits before receiving a ride request over the next hour, helping drivers avoid oversupplied periods where wait-times are long.
- EPH (Earnings Per Hour): Provides drivers with real-time information about the earning potential of airport trips compared to city trips, highlighting the economic value of repositioning to the airport based on marketplace conditions.
- Driver Deficit Forecasting: Predicts marketplace imbalances and actively summons nearby drivers during periods of underavailability, ensuring a robust pool of drivers for re-matches, and reducing rider wait times and encouraging drivers to reposition from the city to the airport.
In the sections that follow, we delve into the architecture, design, and functionality of these models, showing how they transformed the airport experience for drivers and riders alike.
Architecture
Let’s explore the architecture of three Airports forecasting models.
ETR (Estimated Time to Request) Model
Uber’s ETR (Estimated Time to Request) model predicts how long a driver in the FIFO queue waits before receiving a trip request, helping them decide whether it’s worthwhile to enter the queue. The original ETR model relied on a queue-consumption heuristic-based approach, using demand forecasts (predicted demand per minute) and estimated queue length (effective number of drivers in the FIFO queue) to compute wait times:
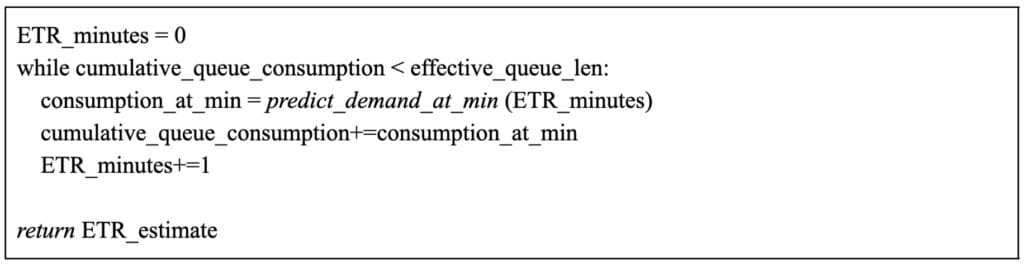
However, this method had significant limitations, particularly in short-wait scenarios (0-15 minutes), where inaccuracies led to misalignment between predictions and actual wait times. This approach of combining two distinct models with math heuristics also made it difficult to define and implement an end-to-end performance monitoring across the entire system.
To improve reliability, a new single ETR model was built using ATR (Actual Time to Request) as a direct training target instead of relying on separate models for estimated queue lengths and forecasted demand. This shift allowed us to align predictions with real-world driver experiences rather than relying on manually defined heuristics.
This new ETR model integrates multiple data sources and relies on Apache Flink®—based streaming pipelines to aggregate and process data from multiple real-time sources, including:
- Queue data: Observed and effective queue lengths, priority matching configurations, and queue abandonment rates.
- Demand data: App engagement metrics, historical ride requests, and flight schedules.
- Weather data: Temperature and precipitation patterns influencing rider behavior.
One of the biggest challenges in building a new ETR model was addressing data inconsistencies in the ATR label, which had issues with spiky data and inconsistencies in rematch-heavy hours. We had to refine ATR data quality by filtering out extreme anomalies and improving label definitions to make the training target more robust. Another challenge was ensuring real-time feature availability, as some near-real-time (NRT) features experienced delays, particularly in low-demand hours. To address this, we improved data pipelines and implemented smoothing techniques for delayed features such as flight arrival data.
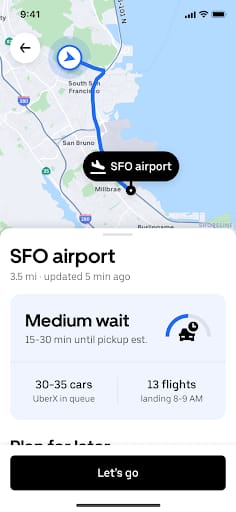
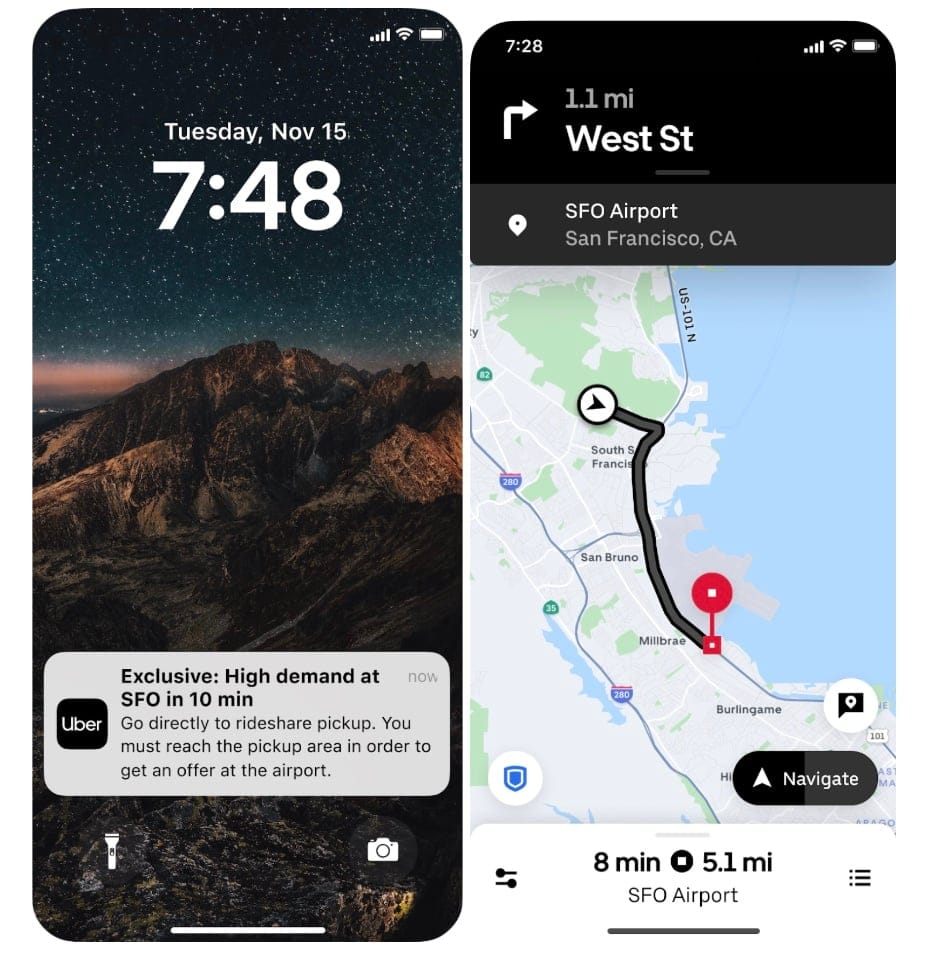
By integrating these improvements, the new ETR model provides significantly higher precision (+30% absolute) for correctly predicting when drivers will experience short wait times (0-15 minutes) upon entering the airport queue. The model now delivers more reliable queue wait time estimates, helping drivers avoid long waits, reducing congestion at staging lots, and improving overall airport operations. Figure 3 shows an example of how this predicted ETR information is surfaced to drivers.
We’ve also experimented with using this ETR signal to send notifications to drivers when predicted ETR is low. Although this notification feature is still under active development, initial experiments have shown positive results.
Airport EPH (Earnings Per Hour Prediction)
In addition to Estimated Time to Request, another important piece of information to help drivers maximize their efficiency are predictions around expected EPH (Earnings Per Hour). Our EPH model provides drivers with real-time insights into the earning potential of airport trips compared to city trips. This information helps drivers decide if repositioning to the airport is worthwhile at any point in time.
Unlike city-level EPH models, which predict earnings in a more geographically broad area, our airport EPH model is focused specifically on predicting EPH for drivers entering the airport FIFO queue. Therefore, it’s much more sensitive to rapid fluctuations in demand from flight arrival patterns. To capture these airport-specific dynamics, the airport EPH model ingests features from the following sources:
- Near-real-time flight arrival and departure information. These signals are aggregated by Flink streaming pipelines into overall arriving and departing passenger counts.
- Near-real-time information on driver surge and rider demand counts to capture the current state of the city marketplace surrounding the airport. Flink streaming pipelines aggregate these signals, capturing marketplace conditions at an airport over the past 1 hour.
- Historical information airport EPH based on past 4 weeks of data. These signals are computed in an autoregressive fashion (for example, EPH 1, 2 weeks ago for the current minute of the week) via daily Apache Spark™ jobs.
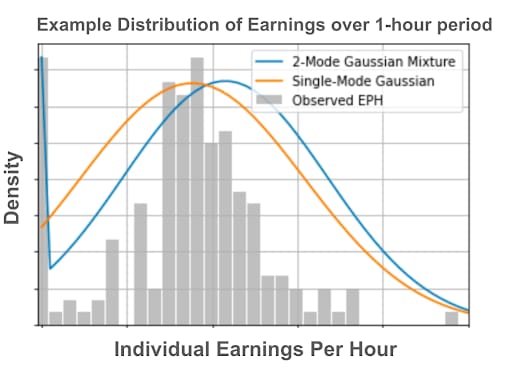
On the model architecture side, we use Deep Probabilistic Models to account for the fact that airport earnings over the next hour are a distribution. Earnings over a given one-hour period will naturally have a dispersion, due to factors like individual driver trip preferences and behavior, as well as randomness in the trip matching process. To model this stochasticity, we introduce a class of Deep GMM (Gaussian Mixture Models), which predicts both the mean and variance of the EPH distribution in real time for a given airport.

Using such a model with multiple Gaussian modes (n >= 2) is important, since the earnings distribution sometimes has a heavy left tail, for example if some drivers get few to no trips when demand is relatively low. In these cases, having multiple Gaussian modes is important in accurately modeling the variance/uncertainty of the associated earnings distribution. Figure 5 is an example of how these probabilistic models can capture much richer information compared to just performing regression against the mean EPH. The GMM model outputs a mean and standard deviation for each Gaussian mode, which are used to draw the distributions for illustrative purposes.
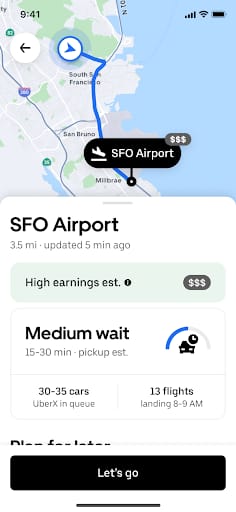
In the current iteration of this product feature, the overall mean EPH predicted by the GMM is surfaced in the Driver app for each airport (see Figure 6). Experiments using this feature have shown significant improvements in airport reliability. In future iterations, we plan to explore using this by either displaying a range of expected EPH values, or filtering/pruning EPH information when both the mean and variance are high.
Driver Deficit Forecasting Model
The Driver Deficit Forecasting model was built to address underavailability by predicting driver deficits in order to proactively summon drivers to the airport during times of predicted underavailability. For this summoning to be actionable, the model forecasts driver deficit in 5-minute intervals over the next 30 minutes.
We treat this model as a time-series forecasting problem: given a time-series of marketplace conditions, and arriving/departing passengers over the past hour, what are the predictions for marketplace conditions over the next 30 minutes? Such a system for real-time time-series forecasting requires 2 components: a data streaming component which appropriately parses input event streams into time-series feature vectors, and a modeling architecture which can appropriately capture the temporal dynamics of this problem.
For the data streaming component, we use Flink streaming pipelines to calculate and aggregate raw marketplace conditions, and flight events into 5-minute buckets. Upon completion of each streaming window, the resulting feature vectors are pushed to an Apache Cassandra®-based key-value store for retrieval during online serving. The overall architecture is shown in Figure 7.

On the modeling side, we adapt a Transformer-encoder style model architecture, inspired by recent research into Transformer-based methods for time-series forecasting. The encoder-only style of Transformers allows the model to learn long-term dependencies between different elements of the time-series feature vectors, without requiring sequential forward passes to autoregressively output a time-series during prediction. The overall model architecture is sketched below. One subtlety here is that we employ 1D convolutional layers to modify the input sequence length of certain layers, since Transformer-encoder blocks can’t change the length of the input sequence.

The final output of this model is a time-series vector of the form [driver_deficit(next_0_5_min), driver_deficit(next_5_10_min), …, driver_deficit(next_25_30_min)]. These model predictions are then passed to a downstream Driver Summoning service, which will notify drivers within certain ETA radii to come to the airport when the predicted driver deficit is positive. The in-app flow for this on-demand summoning of drivers is shown in the screenshot below. This driver summoning product is still under active development and experimentation, and future improvements and iterations are planned in advance of a full production release.
Use Cases at Uber
The integration of Uber’s AI models has brought significant benefits to drivers, riders, airports, and the broader marketplace.
For drivers, the EPH model highlights earning opportunities, while the ETR model reduces uncertainty around queue wait times. Drivers can capitalize on lucrative airport trips, minimizing idle time and unproductive waits. Improved information and active summoning reduces frustration with the FIFO queue system, especially during high-demand periods
For riders, shorter wait times and reduced cancellations improve the overall rider experience.
For airports, improved queue management and proactive summoning reduce the number of idle vehicles in staging lots. A reliable flow of drivers also ensures smoother operations during both peak and off-peak hours.
For Uber, higher trip completion rates and better driver engagement enhance reliability and efficiency. Drivers can seamlessly transition between city and airport trips without losing eligibility, ensuring balanced marketplace conditions across zones.
These benefits have transformed airport operations, making them more efficient and driver-friendly while improving the rider experience and marketplace reliability.
Next Steps
Our work on airports isn’t done, and there are still problems to solve.
Dynamic in-queue ETR is a product we can build to predict wait times for drivers already in the queue, adjusting in real-time based on their position.
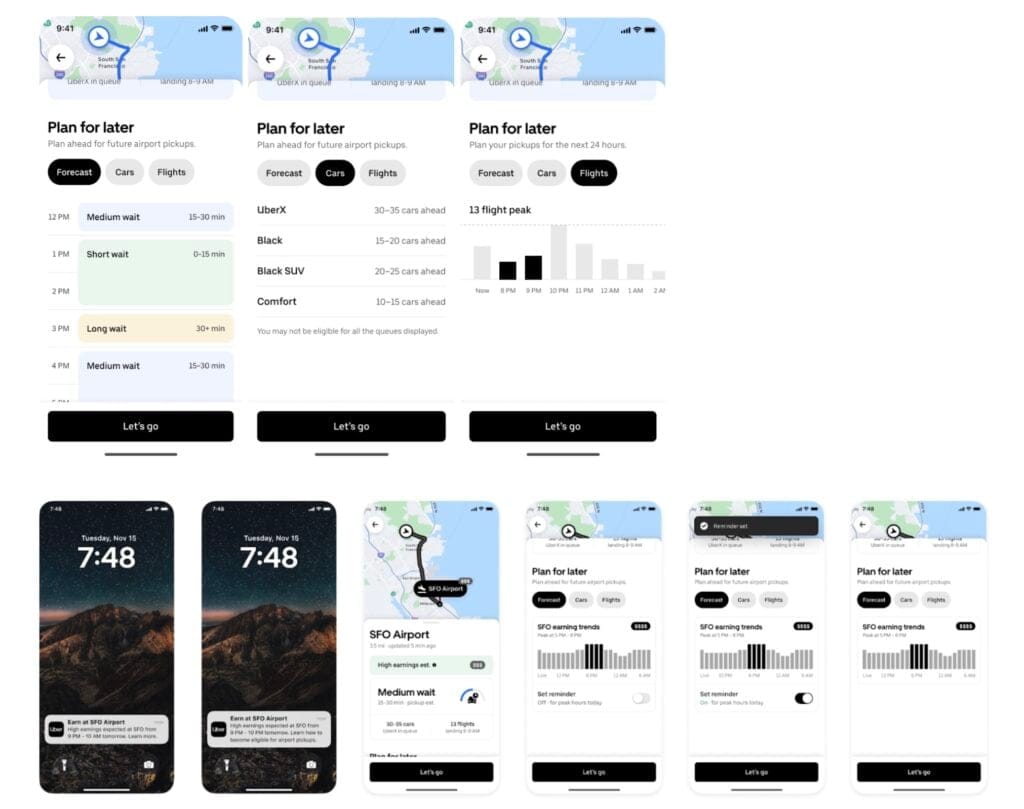
We’d also like to extend our predictions tech to 24-hour or weekly horizons to help drive better planning for drivers, and resource allocation for Uber.
Beyond that, we want to use our models to provide real-time incentives during under-availability to further optimize driver participation.
We also want to expand our trip radar systems (which send offers to drivers on a one-to-many basis, allowing multiple drivers to see the same offer). Once TripRader can incorporate forecasting insights, we can hopefully improve rider-driver matching during underavailability.
Conclusion
Airports are among the most dynamic and complex environments in Uber’s ridesharing ecosystem. By addressing the unique challenges of airport operations—long wait times, unpredictable demand, and intricate workflows—Uber’s AI-driven models have significantly enhanced the experience for both drivers and riders.
For drivers, these tools mean more profitable trips, reduced idle time, and greater confidence in navigating airport workflows. Riders benefit from shorter wait times, fewer cancellations, and a seamless pickup experience. Airports see smoother traffic flow and consistent driver availability, while Uber achieves higher trip completion rates and marketplace health.
As we look ahead, the future of AI in airport operations holds even greater potential. With plans to expand forecasting horizons, integrate matching systems, and introduce real-time incentives, Uber is committed to continuing innovation. By leveraging the power of data and advanced algorithms, Uber aims to set new standards for efficiency and reliability, not just at airports but across the entire ridesharing ecosystem.
Acknowledgments
Special thanks go to our airports teams in making this work possible: Martina Balestra, Amit Dey, Chris Golinski, Mengfei Wu, Sumit Kumar, Amir Kazi, Manoj Panikkar, Christian Momayez Seffat, Ren Xu, Adib Roumani, Dharmin Parikh Himaanshu Gupta, and Lawrence Murray.
Cover Photo Attribution: ”Hong Kong: a modern airport” by charclam is licensed under CC BY 2.0.
Apache Flink®, Apache®, Apache Spark™, Apache Cassandra®, and the star logo are either registered trademarks or trademarks of the Apache Software Foundation in the United States and/or other countries. No endorsement by The Apache Software Foundation is implied by the use of these marks.
Stay up to date with the latest from Uber Engineering—follow us on LinkedIn for our newest blog posts and insights.

Bob Zheng
Bob Zheng is a Machine Learning Engineer on the Uber AI team, leading the development of most of the AI models described in this blog post. He enjoys seeing SOA ML techniques deliver real and measurable value to business use-cases. He enjoys doing mountain activities in his free time, and strives to be more diligent in using sunscreen.

Dhruv Ghulati
Dhruv Ghulati is a former applied AI PM in Amsterdam within Uber AI. When not focused on shipping AI products, he tinkers with immersive digital art projects, organizes storytelling workshops, and runs a creative community of artists.

Manoj Panikkar
Manoj Panikkar is a PM on Uber’s Airports team, working at the intersection of AI, travel, and product strategy. He is focused on building data-driven solutions that create seamless experiences for riders and drivers globally. He enjoys playing frisbee and growing his collection of half-finished books in his spare time.

Michael (Yichuan) Cai
Michael Cai is a Senior Staff Software Engineer and Team Lead on the Airports team. He led many AI/ML projects as well as new growth initiatives like Share rides at airports and Smart Itineraries in the travel space. He enjoys playing ping pong and chess in his spare time.
Posted by Bob Zheng, Dhruv Ghulati, Manoj Panikkar, Michael (Yichuan) Cai