
Introduction
At Uber, we rely on continuous deployment to ensure that changes to thousands of microservices reach production automatically and without human monitoring. This blog explores one of the particularly interesting problems we faced as continuous deployment was adopted across Uber. The problem is summarized as follows: When thousands of services can be changed with a single commit to one of our monorepos, for example, upgrading the RPC library used by virtually every Go service at Uber, how do we minimize the blast radius of a bad change?
As we introduced more deployment automation, we found a clear opportunity to improve our processes in this respect. Our existing safety mechanisms were focused on evaluating the effect of a commit before it’s merged into the code base and on its effect on individual services’ health during deployment.
So, in response to this question, we introduced cross-cutting service deployment orchestration to our continuous deployment system. This gives us the ability to prevent issues from reaching our most important services by using signals from other services, thereby minimizing the risk associated with automation rolling out changes impacting many services.
Background
At Uber, code is organized into a few large monorepos: One for each of our core programming languages. Each of these repositories is the source of hundreds or thousands of microservices, serving the numerous needs of our business. Development is trunk-based and all production releases of these services are built from the main branch.
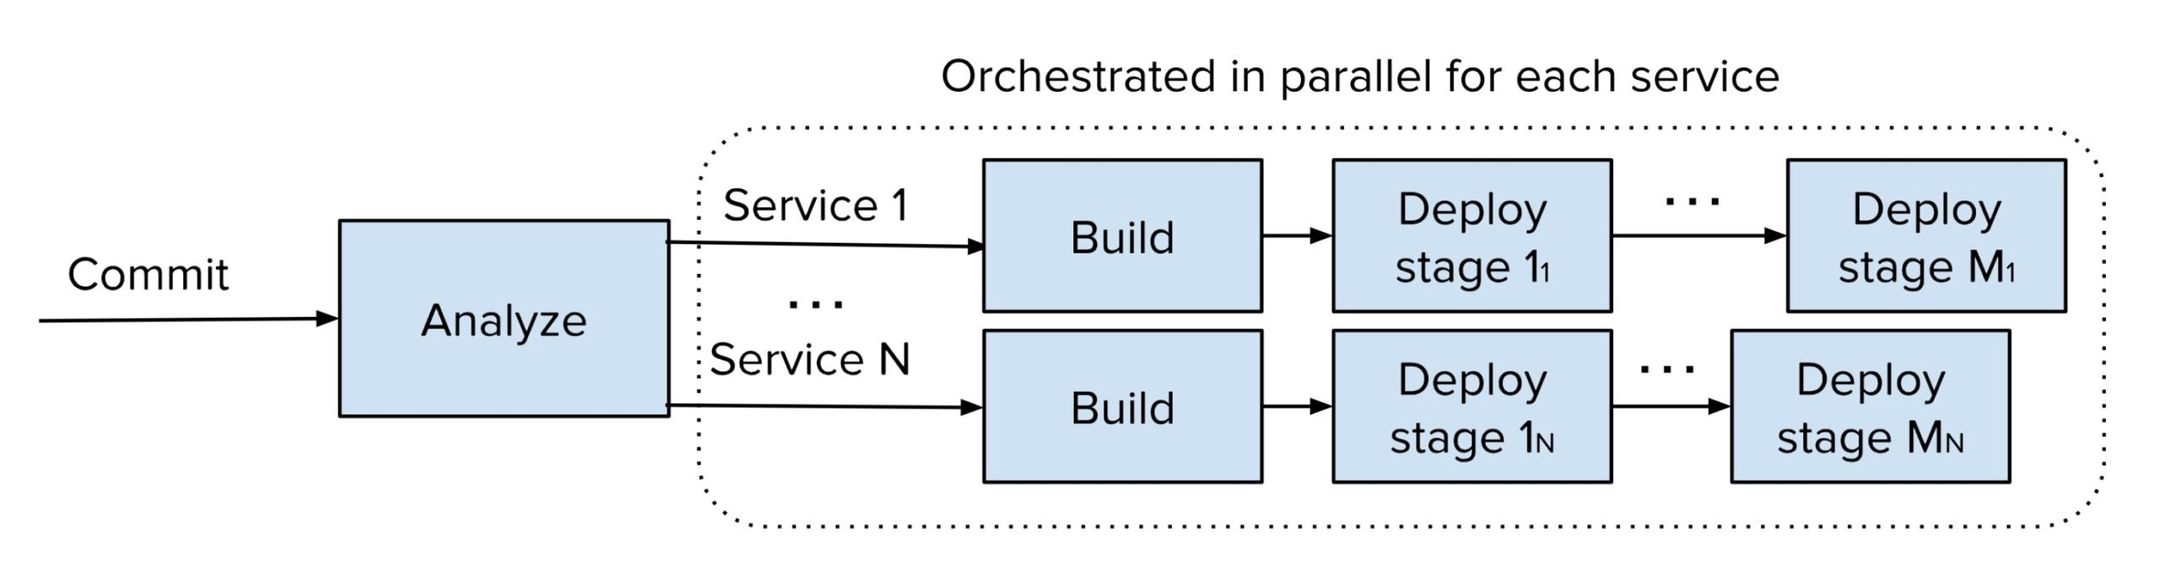
As we detailed in a previous blog post on our continuous deployment system, whenever a change is committed to main in one of our repositories, it’s analyzed to determine the set of services it affects. When a relation is established for a service, orchestration of the commit starts by building a container image, which is then deployed in a series of deployment stages, as visualized in Figure 1.
Adoption of continuous deployment has grown to the point where most microservices rely on fully-automatic production deployments. This poses a new challenge: Because automation means that services start rolling out updates more or less immediately, we found that the risk associated with changing code shared by many services had increased. If a bad large-scale change made it through pre-land unit and integration testing without having its issues detected here, the deployment automation would have the ability to break a lot of services quickly by deploying that change to them simultaneously.
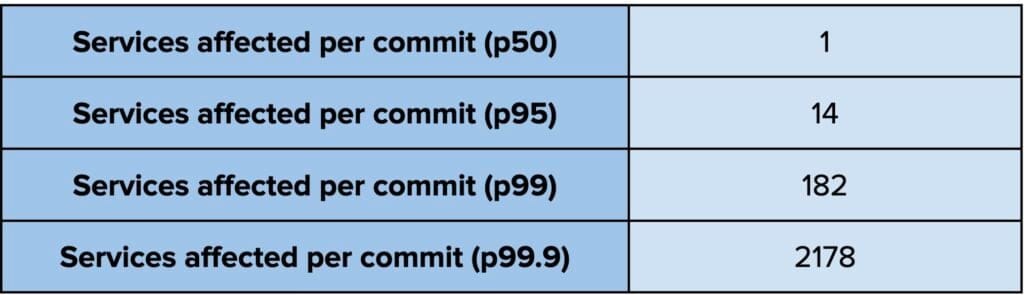
When we dug into the numbers to understand how common large-scale changes are, we found that they happen regularly. Figure 2 provides a summary analysis of 500,000 commits in our Go monorepo and shows that 1.4% of commits affect more than 100 services and 0.3% of commits affect more than 1,000 services. In other words, every week there are multiple commits to the Go monorepo that affect a large portion of Uber, and while the changes made in these aren’t in themselves more risky, the large blast radius means that any risk may be amplified significantly.
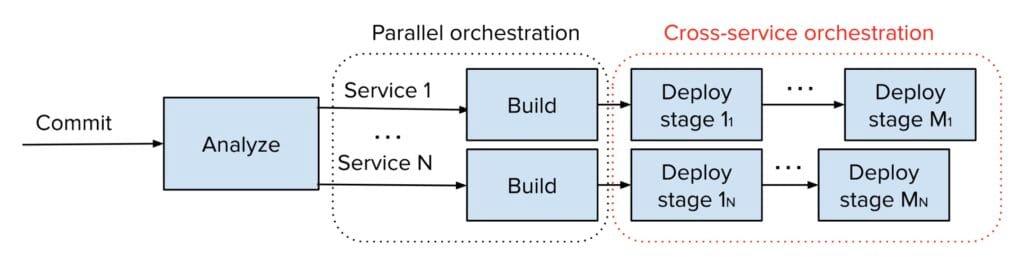
Fortunately, many services, and in particular critical ones that use fully automated production deployment, have solid measures in place to automatically identify detrimental changes during deployment, allowing the deployment system to automatically roll back to a safe version. Nonetheless, a problem might not be automatically detected by every service it would surface in, slipping through the cracks and entering production for some. This is undesirable, especially as other services may be signaling that the change is problematic. It became apparent that we could do better by introducing cross-service orchestration, utilizing signals (both positive and negative) from other services to ensure that changes were safely deployed across all affected services. With this, the high-level orchestration flow in Figure 1 would instead become as shown in Figure 3.
Architecture
The overall architecture of our continuous deployment system was laid out in a prior blog post. Here, we’ll therefore just reiterate a few parts of particular relevance for the topic at hand.
The flow in Figure 1 can succinctly be described as a build stage followed by a number of deployment stages. Each of these stages is fairly straightforward, so the more intricate logic is in how the system advances a commit through the stages. This logic is encapsulated in a workflow for each deployment stage, which runs periodically to determine if any commits are ready to start the stage. This examines several gating conditions, which can, for example, include:
- Have any commits successfully completed the prior stage?
- Have these soaked for the desired time since they completed the prior deployment?
- Are we within a user-defined deployment window, typically the owning team’s business hours?
- Are there any alerts firing for the service that would prevent deployment?
When all of these are satisfactorily answered, the system advances the commit and triggers deployment. At this point, the deployment is handled by the deployment engine, which holds the responsibility for upgrading the service safely.
Given the modular nature of our gating conditions, to introduce cross-cutting orchestration, all we had to do was, essentially, to introduce a new condition to be considered. This condition would be somewhat different from the others though, as it couldn’t be local to each service—it’d have to be common across all the services impacted by a commit. We also wanted it to be lightweight, as there’d frequently be thousands of services checking the same condition, so having every gate check the state of all other services would scale poorly.
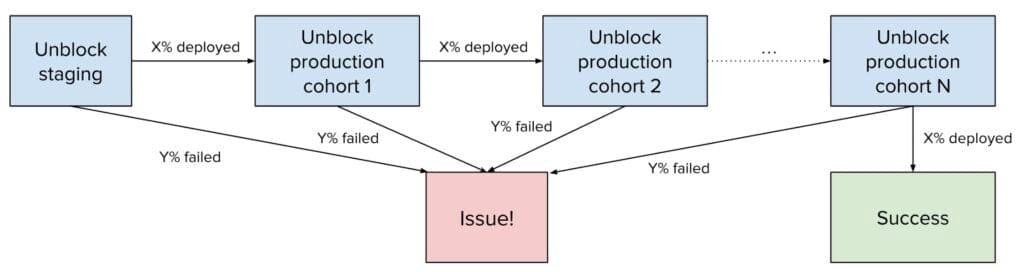
For this reason, we introduced an asynchronous process to maintain a simple state machine for each large-scale commit to be orchestrated in this way. Each of the gates can then simply look up the current state to understand whether the orchestration is currently imposing any conditions for this particular service, knowing what cohort the service is part of. Implementation of the state machine itself is via a periodic job that aggregates the deployment status for all the services impacted by a commit, proceeding the state machine when a sufficient number of services are deployed successfully. If, instead, it finds too many failures, it flags the commit as having an issue. This state machine is visualized in Figure 4.
To group services into cohorts, we use our internal service tiering, where services are classified from 0-5 with tier 0 being the most critical and tier 5 the least. Using this, we could, for example, specify that X% of tier 5 services must be successfully deployed before we unblock automatic deployments of tier 4, and so on. Selecting the threshold is a balancing act, because we want things to progress at a pace balancing speed with safety. We’ll explore this in more detail later.
In the event that an issue was flagged due to too many errors, we introduced the concept of commit issues to the continuous deployment system. These are used to indicate an issue (and its eventual resolution) for any commit, and prevent deployment of a problematic commit without inclusion of its fix. When the orchestration flags an issue with a commit, the author of the change is immediately notified, so they can investigate and determine the course of action, which could, for example, be to revert the change.
An error in this context means any failure to deploy a service, which would typically be an automated alert going off, for example due to elevated container resource usage indicating a performance regression introduced by the commit, or a service-specific SLA being violated due to some other unexpected side effect of the change. Errors could also be hard failures to start service containers in case of a catastrophic bug affecting some edge case or service cohort that wasn’t covered in pre-land testing. In either case, these cause affected services to roll back and count against the error rate for services in the cohort (service tier) currently being rolled out.
From the perspective of individual service owners, this feature will intermittently block their service from automatic production deployments, while the commit is being validated through other services of less critical tiers. To not harm developer productivity or release timelines, we therefore need to be diligent about how long these blockages last and ensure that orchestration progresses at a reasonable pace.
Productionizing
With the architecture established, we had to parameterize the system. This would be a balancing act, with two conflicting objectives: (1) Deploy many services to capture a strong signal about the health of the change and (2) progress quickly to unblock services in later cohorts.
Because critical cross-cutting changes aren’t that common, to ship quickly, we initially picked out some simple parameters and decided to productionize the system with these. However, it became apparent that the intuition that we had around what these should be were too far tipped in favor of the first objective, leading to too slow progress and critical services falling too far behind HEAD of the main branch, leading to delayed feature deployment. So we decided to take a data driven approach, targeting a maximum of 24 hours to unblock all services, aiming to get as much signal in that time frame as possible.
To meaningfully tune the system to reach this target, we’d need some way to predict what the effect of a parameter change would be. We came up with an approach to combine historical deployment data, all the services’ user-specified continuous deployment configurations, and the orchestration parameters to predict how long it’d take before each cohort would be unblocked. We knew that this would require a number of simplifying assumptions, but decided that it would be desirable to start with a simpler model and increase complexity only where it was really necessary. Our approach was to build a simulator, allowing us to speed up time for the continuous deployment system’s orchestration, thereby providing a prediction of when each cohort would be unblocked.
The first task of this was to help us understand the impact of the orchestration start time, that is, the moment the change to be rolled out gradually across services is made available on the repository’s main branch. We knew that this would be important, because we’d need to deploy a certain number of services in each cohort, and we had to respect each service’s user-defined continuous deployment configuration, so we could, for example, only make the automation deploy them during the owning teams’ selected time windows, typically aligning with their business hours. For any service, these user-defined configurations tend to dominate the overall duration between commit land and production deployment. Figure 5 shows the results of a simulation with our original parameters, with start times varying across a week.

It’s clear that the start time in fact has a significant impact on the overall progression of the orchestration. In fact, it was only able to complete within the week it was started if the commit was landed before 22:00 UTC (14:00 PST) on Monday, which we thought was a too narrow window for starting it. Moreover, even in the best case, our prediction was that tier 1 services would be blocked for 40 hours, far from our goal of 24 hours.
More importantly, we could now use the simulator to discover the impact of tuning parameters of the system. We could, for example, tweak the orchestration progress threshold, change the grouping into larger cohorts, or enforce policies on the services’ continuous deployment configurations. Comparing various combinations, we found a set of parameters that appeared suitable for reaching our goals. Figure 6 shows the updated predictions.

At this point, we observe a much flatter, more predictable behavior, where all cohorts are expected to be unblocked within 24 hours, and where orchestration may be initiated Monday through Wednesday to complete in the same week.
The profile of this simulation matched what we were looking for, so we updated production parameters to match what the simulation used. At this point, we waited attentively for a critical change to trigger the orchestration, so we could see whether our predictions would hold when faced with reality.
Soon after we made these changes, we were rewarded with a few critical large-scale changes exercising this feature, letting us compare the simulation’s predictions to reality. Fortunately, we were happy to learn that the predictions and reality matched up well, validating our approach.
Use Cases
Today, we’re using this feature to release large-scale changes incrementally across services, increasing confidence that the changes are sound prior to being deployed to our most critical services.
However, it also turned out to be a solid fit for a secondary use case: Incremental deployment of identical services differing only by their configuration. For example, we operate hundreds of stateless services that serve machine-learning models to many applications. All changes to these services are orchestrated with this feature, letting releases to the cohorts serving more critical requests be contingent on successful release to less critical cohorts.
Next Steps
By implementing incremental cross-service rollout orchestration for critical large-scale changes, we’ve increased deployment safety when cross-cutting changes affect hundreds or thousands of services at once. It continues to be a trade-off between deployment velocity and confidence in the change, so we’re actively monitoring and revisiting on a regular basis to make sure we’re maintaining the right balance. Fortunately, we now know that we can, in fact, use simulations to understand the effect of proposed changes, thereby letting our team make better forward-looking decisions.
As we continue to revisit this feature, we’re continually looking for ways to improve the signal and/or speed up the orchestration without harming the signal. For example, it might be sensible to increase the weight of the signal for services that are known to be very good at detecting issues during deployment, while services that often miss issues can have their weight reduced.
Incidents due to this type of large-scale code changes were previously infrequent, but could be extremely severe. Over time, we expect to see further reductions in this type of incident and a reduced blast radius, should something still manage to slip through the cracks.
Conclusion
In this blog post, we discussed a particularly interesting problem resulting from adoption of fully automated continuous deployment for large numbers of microservices in a monorepo, namely how to control the risk of automatically deploying commits that affect a large portion of those services. To reduce this risk, we introduced incremental cross-service deployment orchestration to incrementally build confidence in large-scale changes. We also discussed the steps we took to figure out the right parametrization of this feature to balance safety and developer velocity.
Cover photo “domino” by barryskeates under CC BY 2.0 license.
Stay up to date with the latest from Uber Engineering—follow us on LinkedIn for our newest blog posts and insights.

Aron Lorincz
Aron Lorincz is a Senior Software Engineer on Up, our stateless deployment platform. Aron works on Continuous Deployment of various types of workloads.

Goncalo Alvarez
Goncalo Alvarez is Engineering Manager II for Deploy Experience across stateful and stateless platforms at Uber. He works hard to ensure thousands of engineers across Uber have an effective and delightful experience when deploying their workloads to production.

Rasmus Vestergaard
Rasmus Vestergaard is a former Senior Software Engineer of the stateless deployment platform (Up) team. He worked on microservice build and deployment systems.
Posted by Aron Lorincz, Goncalo Alvarez, Rasmus Vestergaard