
For those unfamiliar with the work of Uber’s Visualization group, our team focuses on delivering data products for a variety of customers, from city authorities to self-driving engineers. We support the organization with advanced products to better understand self-driving car, geospatial, and business data in the context of urban mobility.
The interactive systems we develop enhance people’s ability to understand and communicate data. At Uber, these systems are used in a variety of domains, helping teams understand real-time positioning of vehicles, analyze supply and demand information by region, interpret systems like routing, navigation, and dispatch, identify gaps in the rider pick-up experience, and debug perception, prediction, and motion planning data flowing through our self-driving cars. By encoding data into visual marks and channels, we give users the ability to quickly spot distributions, trends, and outliers in the information that is critical to improving the performance of a system.
It’s been a great year for visualization at Uber. In 2018 our group has doubled down on four different tracks:
- Supporting cities as a customer by delivering products useful to city planning and transportation researchers that provide insights into mobility and more generally help solve problems in the domain of urban computing.
- Launching new open source products and frameworks that have been leveraged internally but also externally by multiple organizations and businesses, forming new external partnerships.
- More deeply engaging with the community by supporting and organizing events with high-caliber speakers, publishing papers to academic conferences, providing lectures at universities, and openly discussing complex topics in the realm of visualization and urban computing.
- Our original mission of supporting Uber’s multiple verticals, including ATG, Freight, Uber Eats, Marketplace, Maps, and our Product Platform, empowering these groups with advanced products to better understand and operate their businesses.
Cities as a customer
2018 has seen the launch of a stronger brand behind Movement, our initiative to provide data insights to city authorities, researchers, and urban planners to better understand challenges that arise with urban mobility and urban computing more generally.
In October, we released a visualization product that provides insights on mobility for JUMP bikes in their cities of operation. This data is essential for urban areas to evaluate the success of their shared bike programs by taking into account important metrics such as bike utilization in areas traditionally underserved by public transport.
As part of the open data initiatives we are driving through Uber Movement, we’ve released a new dashboard for cities to explore mobility data for JUMP bikes and scooters. Excited to have been part of the team who built this! @UberEng https://t.co/enYjNsJeA1 pic.twitter.com/iJrGIvBiiW
— Wesam Manassra (@Manassra) October 26, 2018
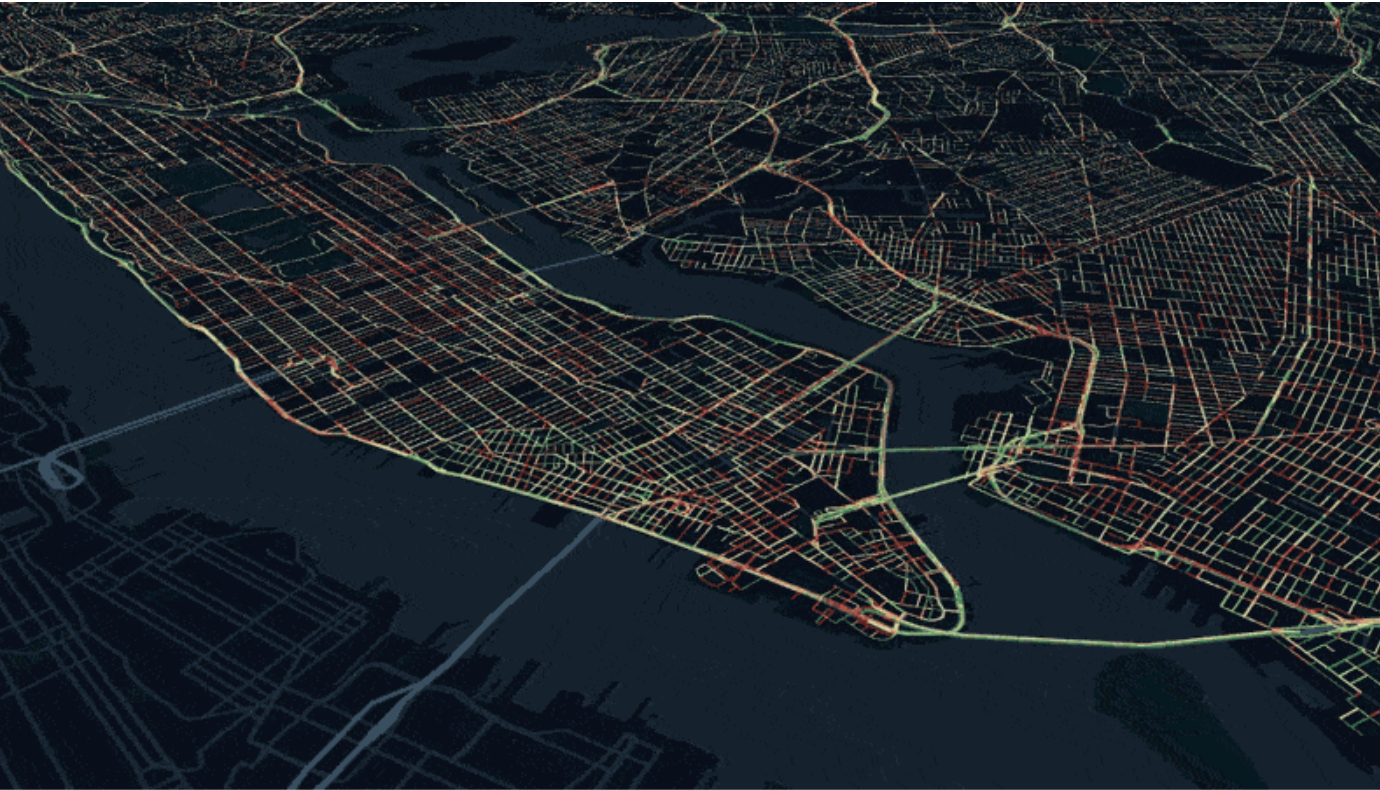
We also announced the release of a new open data set through Movement: Speeds data. Speeds is provided via Movement using the open standard created by SharedStreets , a non-profit initiative supported by the National Association of City Transportation Officials and the Open Transport Partnership. In addition, Uber deepened its commitment to long-term, open standards with a $250,000 grant to SharedStreets to help fund their valuable work.
Finally, some of these data sets have already been used by multiple research organizations, including Stanford University and more recently the Traffic21 lab at Carnegie Mellon University.
�
Open source
2018 was also a big year for our team’s open source work. We released Kepler.gl, an advanced exploratory analysis tool for geospatial data which was very well-received by our customers. People across the world have visualized all kinds of data including building structures, energy consumption, pick-up/drop-off information, phone network data, property prices, distribution of trees, hurricane data, oil and gas data, wildfires, air quality data, maritime information, and more.
Kepler.gl has also introduced new partnerships for Uber, like our collaboration with Mapbox, which we further expanded this year with a deeper integration with deck.gl.

Finally, Kepler.gl has received recognition from multiple organizations as a state-of-the-art tool for geospatial visualization, including being a semi-finalist in the U.S. Department of Transportation Safety Data Challenge and winning gold at the prestigious Information is Beautiful awards in NYC.
Kepler.gl is also available to engineers as open source code that can be customized and extended in multiple ways. It is dependent on other powerful libraries like deck.gl, which this year has also received many notable improvements.
This year, deck.gl users have broadened to multiple organizations, including Mapbox, NVIDIA, moovel, and LimeBike. Moovel released their digital exploration tool for airline flights using deck.gl in their Flights to Rome app. Additionally, FOAM.space used deck.gl to explain their distributed proof of location system based on blockchain.

Engaging and supporting the visualization community
Doubling our commitment to support and engage with the visualization community in 2018, we launched a monthly newsletter about our external facing work. These newsletters cover our external partnerships and engagements, and reference interesting articles in visualization that our group has been reading—you should sign up to read them!
We also invested in research this year, with one technical paper (TVCG, arXiv) accepted at IEEE VIS on machine learning visualization. Our group presented at VisInPractice along with other visualization practitioners, and we submitted a short paper for a poster on Myriahedral Projections.
Glad to see Uber Visualization’s work on machine learning visualization and myriahedral projections presented at #IEEEVis in Berlin this year. Looking forward to the next edition of Vis! pic.twitter.com/lZQfW2tzoo
— Nicolas Belmonte (@philogb) October 28, 2018
Our team presenting their work in Berlin at IEEE VIS.
Our group sponsored the OpenVisConf, a prestigious conference for visualization, presented at GeoCom in London, CARTO Spatial Data Science Conference in NYC, PushConf in Germany, MediaParty in Argentina, FEDAY in China, Fifth Elephant in India, Mapbox’s Locate in San Francisco, and Facebook’s @Scale conference. We also organized multiple conferences, including our #VisualizationNights, which had high-caliber speakers and great attendance.

Finally, our team served as data visualization lecturers for the graduate’s master’s program in Business Analytics at UC Davis, teaching Visualization to 40-plus students this past the fall.
Last visualization lecture for the fall @ucdavis , gonna miss this class! pic.twitter.com/bo6zgYCQ60
— Nicolas Belmonte (@philogb) December 7, 2018
Our mission
Although we kept busy in 2018, we never lost track of our original mission: to empower teams at Uber to create safer, more reliable transportation by providing expertise in data visualization and analysis. For this, our group embedded visualization practitioners in business verticals like Uber Freight (helping support Shipper Tools), Uber Eats, and ATG.
Our group also pioneered the use of augmented reality to solve challenges for riders and delivery-partners, invested in internal machine learning visualization to develop platforms that hundreds of data scientists use on a monthly basis, and supported multiple business intelligence needs, including funnel visualizations in Uber’s Project Maze. While many of these projects can’t be shared broadly, the public-facing work we’re provides insights into our day-to-day jobs on Uber’s Visualization team.
A glimpse of what I have been working on this past year: visualizing aggregate sequence of events. https://t.co/mtDaDKQ8Rk
— Jerome Cukier (@jcukier) August 16, 2018
I hope you enjoyed this summary of the work the Visualization team did in 2018. Stay tuned, as we still have some big announcements to come in the New Year!
If you’re interested in pursuing careers with Uber Visualization, please check our careers page.
Sign-up for Uber Visualization updates by subscribing to our monthly newsletter.

Nicolas Garcia Belmonte
Nicolas Garcia Belmonte is Director of Engineering, Urban Computing and Visualization, at Uber.
Posted by Nicolas Garcia Belmonte