How Uber Standardized Mobile Analytics for Cross-Platform Insights
2 October 2025 / Global
Introduction: Mobile Analytics at Uber
At Uber, we prioritize the end user experience. To identify poor or broken experiences, we must understand how people interact with our apps throughout their journey. To accomplish this, product teams instrument UI components so the apps emit analytics events whenever a rider, driver, Uber Eats user, or courier views or interacts with them.
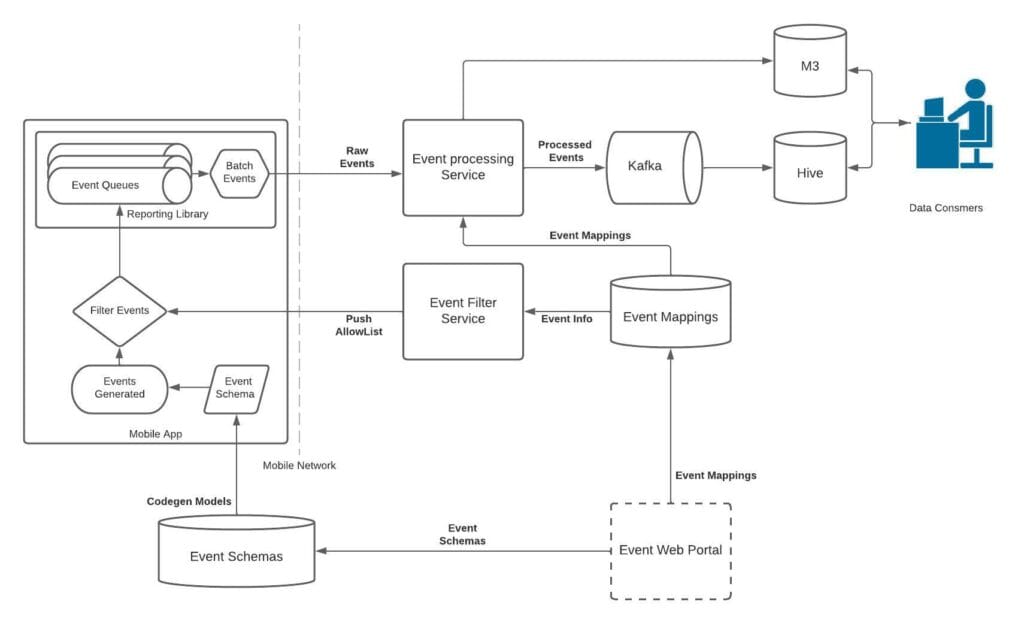
At a high level, here’s the workflow for how mobile engineers add mobile analytics:
- Definition. Engineers design an event and any custom metadata, define it in a generic Apache Thrift™ schema, and assign it a UUID that’s later mapped to a human-readable name in the back end.
- Generation. The Thrift schemas are code-generated into native Swift® and Kotlin® models and committed to the mobile monorepos.
- Instrumentation. Engineers attach the event and its metadata to the UI component that emits it.
- Emission. When someone interacts with the UI, the event is generated, batched, and logged together with common app metadata from a central reporting library. Events that aren’t actively used can be disabled client-side, and re-enabled later remotely by UUID.
- Processing. A central back-end service receives the event, enriches the data, and routes it to the appropriate pipelines.
- Consumption. Engineers, data scientists, product managers, and marketing managers access the data via online and offline sources.
The data produced by this pipeline is critical for deriving insights, monitoring feature health, optimizing the user journey, and personalizing the app with ML-driven recommendations.
This blog describes how we standardized mobile analytics at Uber by unifying event instrumentation, collecting consistent metadata, and providing sampled event coverage.
The Problem: Inconsistent Event Data
Although the Mobile Data Platform standardizes the base event schema and upload infrastructure, individual teams still own emission rules and instrumentation. That gap created several pain points for both developers and data consumers.
- No standardized event definitions. While tap and impression types existed, the platform didn’t specify exactly when to emit them, and events like scroll had no official type. Each team devised its own approach, leading to fragmented data across features and platforms.
- Missing instrumentation in common UI components. Shared UI components lacked analytics hooks, forcing feature engineers to add event logging manually at the feature level, instead of relying on base platform implementations. Lists in particular were missing many common required capabilities and metadata.
- Duplicated shared metadata. Because the platform didn’t supply commonly needed data, engineers added them ad-hoc, often duplicating values and using inconsistent names.
- Overuse of ad-hoc custom events. In the absence of platform-level event types, over 40% of events became catch-all custom logs, degrading the annotation quality of the produced data.
- No visibility of unmapped or disabled events. Events that were unmapped or disabled were dropped on-device, delaying analyses if they later became important.
Together, these issues increased engineering effort, reduced data consistency and quality, and made insights harder to extract.
Uber’s Approach to Standardized Mobile Analytics
Uber is fairly unique in that the platform teams serve a broad variety of feature teams and multiple mobile applications. So, the Mobile Analytics team met with a broad range of stakeholders (including design and data science) to understand the best set of features to develop to address pain points.
After multiple listening sessions, we redesigned core aspects of the mobile analytics stack: we moved common metadata tracking and emission logic from individual features into the platform, simplifying and standardizing analytics for engineers.
Standardized Events
The Analytics team defined core event types and emission rules. These definitions are instrumented across every Uber mobile app platform, ensuring consistency across features and platforms.
These were the first events we standardized, with plans to expand the set after launch:
- Tap: Triggered when someone interacts with a UI component, resulting in an internal state change.
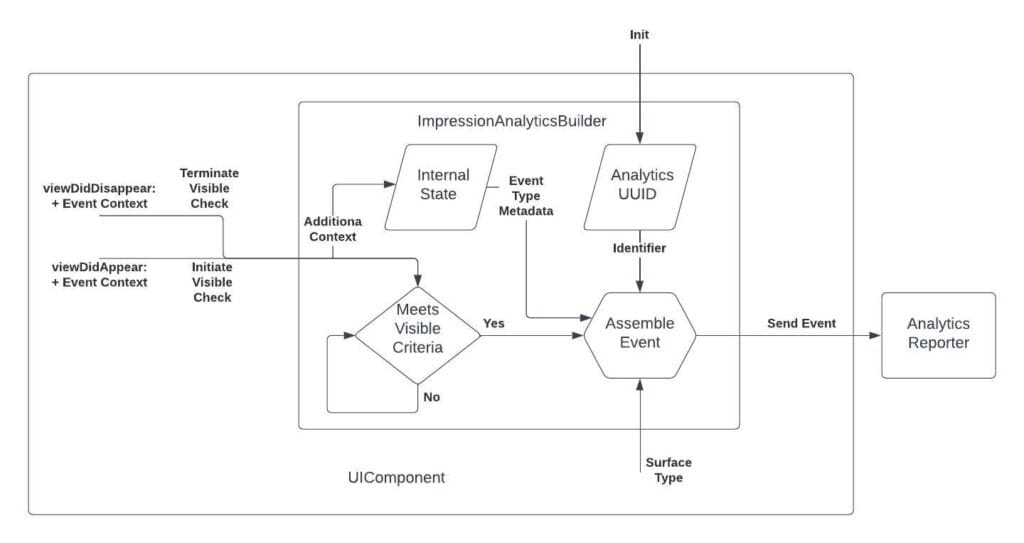
- Impression: Triggered when >= 50% of the view is visible for more than 500 milliseconds. This is to register a meaningful impression for the user.
- Scroll: Triggered when the scroll view begins and ends scrolling. This results in two events, a scroll start and a scroll stop event.
AnalyticsBuilder classes, one per event type, encapsulate business logic for event emission within the UI component. This separates analytics tracking from View logic, enabling code reuse across UI components. AnalyticsBuilder objects track view updates (like appear/disappear callbacks) to determine event emission.
When introducing the new impression emission logic, we developed a rigorous performance stress test for the framework by developing a sample application containing 100 impression logging components. This revealed no CPU-usage or frame-drop regressions, so we were able to proceed with confidence to know we wouldn’t be negatively impacting the end user experience.
With the emission logic encapsulated in AnalyticsBuilder and tested for performance, we instrumented all 50 common UI components, ensuring that every standard event was available across the apps.
New Common Metadata Collections
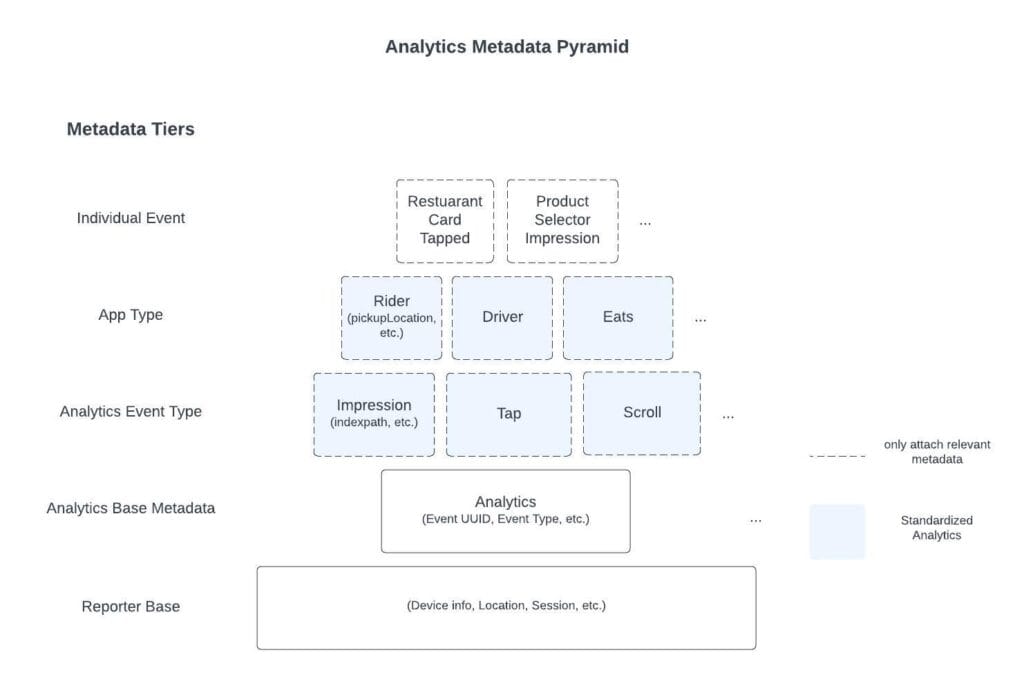
To eliminate redundant values and reduce developer effort, we now attach common metadata to every event at the app and event-type levels.
- App-level metadata. For data that applies to every event in an app (like a pickup location in the Rider app or a restaurant UUID in the Eats app), engineers set the value once. The platform logs it automatically.
- Event type metadata. Fields that belong with every event of a type (like, list index, row identifiers, scroll direction, view position) are now captured automatically by AnalyticsBuilder.
- Standard surface. We codified the design-system list of surface types in Thrift, generated models for both platforms, and required emitting components to implement a StandardSurface interface so the surface is always logged. For example, ViewController in iOS and ViewGroup in Android send CONTAINER_VIEW as StandardSurface, buttons components are logged BUTTON, sliders are logged SLIDER, and so on.
Complete Sampled Coverage of Events
Finally, we sample 0.1% of sessions (hashing the session UUID) and log all events, even those disabled or unmapped, to a dedicated table, letting engineers disable potentially unneeded events without losing all visibility to the data.
Standardized Analytics Pilot: Getting Early Signal
By partnering with product teams, we dual-emitted analytics for two features through both legacy and new APIs on iOS and Android to compare results directly.
Event Validation
To validate that the platform performed as expected in production, we wrote a set of queries to identify any anomalies in the event data. Volume verified similar volumes between systems, except for impressions with stricter visibility rules. Metadata confirmed app- and event-type metadata and surfaces matched across platforms. Semantics checked ratios like scroll-start/stop counts and view-position values.
Learnings
We learned a lot from the pilot process. First, we uncovered platform discrepancies. The process of implementing the same events on both platforms revealed divergent logging approaches and differing UI components between iOS and Android.
We also saw significant benefits from the list enhancements. For the pilot features, numerous separate list events were combined into a single event. This was achieved by using indexpath and row identifier to distinguish between various row taps and impressions, simplifying querying and data consumption. Standardizing the events in the UI platform layers also improved testability and separation of concerns.
During the pilot, we also saw demand for visibility tracking. Some feature teams proactively adopted the platform’s visibility checks, reducing bespoke implementations for their own use cases, such as for auditing.
Broad Adoption and Migration
After the pilot validated the platform, we broadened adoption by migrating legacy events to the Standardized APIs with a combination of centralized and distributed migrations.
Central Migrations
Where possible, our platform team performed the work ourselves to keep product teams focused on their roadmaps. In some cases we could simply swap legacy analytics APIs for the new standard APIs, automatically upgrading events to include the latest metadata and follow emission rules.
We also added a linter which blocked any new tap or impression events created with non-standard APIs, stopping further drift and publicizing the new system.
Distributed Migrations
For code we couldn’t migrate ourselves, we partnered with each product team to support their feature migration. To ease the burden on the teams, we developed automated scripts. These scripts scan our iOS and Android code, assess the status of high-tier events, and produce a list indicating which events are straightforward to migrate.
We tackled high-tier, heavily-queried events first and set clear, achievable targets. Detailed runbooks quantified the gains—fewer lines of code and higher-quality data—to justify the effort and facilitate onboarding.
Benefits to Engineers and Data Consumers
Based on the broad adoption of the new standardized analytics platform, here are the key benefits we’ve found.
Data Consumers
- Clear semantics. Standard event types now behave consistently across apps and features, eliminating guesswork for data consumers.
- Cross-platform parity. The migration resolved emission discrepancies between iOS and Android, enabling reliable cross-platform analysis.
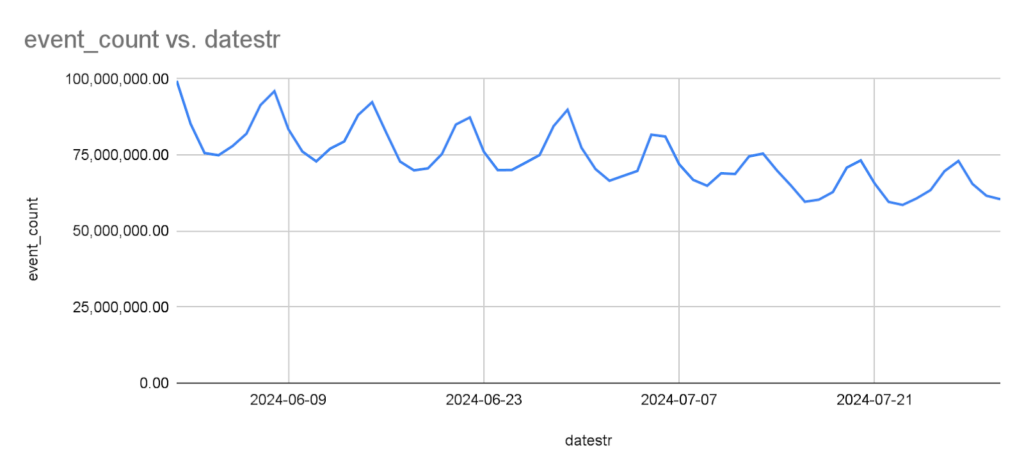
- Accurate impression counts. The more consistent impression definition reduced transient-view impressions by up to 30%, providing data consumers with a more accurate picture of user impression counts (see Figure 4).
- High reliability. Eliminated error-prone manual event additions, ensuring consistent event tracking and reducing the risk of missed or duplicate analytics.
- Lower data volume via sampling. Having complete event coverage via sampling enables teams to disable high-volume custom events while still maintaining a fallback dataset, freeing bandwidth for business traffic or more important events.
Data Producers
- Fewer lines of instrumentation code. Adding a tap or impression now takes only a few lines instead of dozens. Metadata is automatically attached with the streamlined instrumentation process, further standardizing the fields included with the events.
- Out-of-the-box coverage. UI components already emit the standardized user interaction events engineers need, meaning engineers didn’t need to reinvent the wheel to generate these metrics.
- Extensible architecture to cover other event types. AnalyticsBuilders allow easy platform extension for more event types, each with unique triggers, standard surfaces, and shared metadata. Deep links, push notifications, and feature errors are the next set being considered.
- Faster onboarding for new users. New users can onboard to the platform with less guidance through the standardized patterns. The reduction in custom logic accelerates new user ramp-up time and improves collaborations between teams.
Ongoing Analytics Platform Standardization Efforts
Following the successful adoption and rollout of standardized analytics, we’re continuing our efforts in this domain. Our aim is to further reduce developer effort, enhance data quality, and maintain cost efficiency.
We’re working to further simplify the developer experience and standardize event naming by introducing components as a first-class entity in our analytics platform.
A component is defined as a distinct entity capable of emitting analytics, such as a button, a list, or a slider. Each component will be assigned a unique component ID. This ID, combined with the event type, will uniquely identify all generated analytics events on the back end. Engineers will only need to provide a component specifier name when mapping a component on the back end. This will be used to generate all events originating from that component.
The event names generated by a component will automatically be populated using the following method:
[component_specifier]_[component_surface_type]_[event_type]
Currently, a button emitting both a tap and an impression would necessitate two unique event IDs and two back-end-mapped events. However, componentization streamlines this to a single UUID and one mapped component. This halves the effort and standardizes the naming convention.
Take the example shown in Figure 5 for component specifier: production_selection and component type: button.
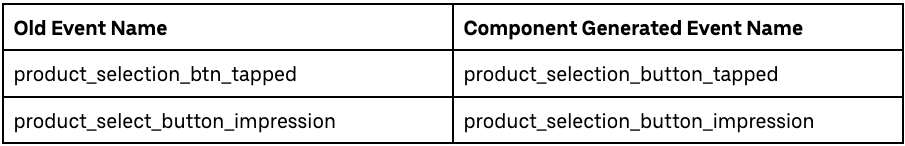
The original naming method allowed for inconsistencies in event names, whereas the new component-generated names offer a more structured approach, significantly improving consistency. This structured process can be extended to various event and component types, including both UI and non-UI elements.
Standardized common event mapping metadata (tier, life cycle, team) will be automatically propagated to all events under a component, ensuring consistency with the parent component. This simplifies data tracing, querying, and interpretation for consumers and allows teams to manage event life cycles more effectively within a single component, reducing inconsistent, orphaned, or untracked events.
With componentization, through the use of component IDs and associated tooling, we aim to enhance standardization and improve the experience for data producers and consumers.
Conclusion
Uber’s analytics standardization journey has significantly enhanced its mobile analytics data quality through defining standard event emission rules, consistent instrumentation, and automatic metadata collection. The strategy encompasses encapsulating analytics logic, instrumenting all UI components, and the future promise of componentization. This effort has led to greater data consistency and a reduction in engineering workload. These efforts will allow for a scalable, reliable, and trustworthy cross-platform analytics system—ultimately enabling a more precise understanding of end user behavior and optimal business decision-making.
For other companies, the key takeaway is to push as much of the event definition, instrumentation, and metadata tracking into the platform components and out of the feature layer. Leverage a standardized API for feature owners to use to minimize the effort required on their end. This ensures consistent data emission, metadata, and the highest quality end data for consumers to use.
Cover Photo Attribution: “data (scrabble)” by justgrimes is licensed under CC BY-SA 2.0.
Android is a trademark of Google LLC.
Apache, Apache Thrift, and the Apache feather logo are trademarks of The Apache Software Foundation.
IOS is a trademark or registered trademark of Cisco in the U.S. and other countries and is used under license.
Kotlin® is a registered trademark of the Kotlin Foundation.
Swift® and the Swift logo are trademarks of Apple® Inc.
Stay up to date with the latest from Uber Engineering—follow us on LinkedIn for our newest blog posts and insights.

Ben Hjerrild
Ben Hjerrild is the Tech Lead and Staff Engineer for the Mobile Data Platform team.

Rajat Sharma
Rajat Sharma is a Senior Software Engineer on the Rider Foundations team with a key focus on improving the reliability and performance of the Uber app.

Shawn Dong
Shawn Dong is a Senior Software Engineer on the Mobile Data Platform team. His area of expertise is backend development for the data analytics platform.

Wugang Zhao
Wugang Zhao is an Engineering Director at Uber. He leads the mobile platform, web platform, and test infrastructure at Uber.
Posted by Ben Hjerrild, Rajat Sharma, Shawn Dong, Wugang Zhao