Cinnamon: Using Century Old Tech to Build a Mean Load Shedder
November 22, 2023 / Global
Introduction
Uber has thousands of microservices that serve its ~130M monthly customers such as riders, eaters and earners. The traffic from these customers leads to millions of requests per second (i.e., RPS) aggregated across our services, both directly from online traffic (e.g., a user pressing a button in the app), but also indirectly from offline traffic (e.g., a batch job that does aggregation over trips). With that complexity, we’re bound to have cases where one or more services are overloaded, due to traffic spikes (e.g., a too-aggressive batch job) or slowness (e.g., a database gets slow).
To mitigate these overload situations, it is vital to do graceful degradation, where we shed lower-priority requests (e.g., batch jobs) before any high-priority requests (e.g., online customer requests). Our goal is to ensure a good user experience, even when parts of our backend are having load issues. Given Uber’s service footprint, any solution for graceful degradation also has to be automatic and require no configuration, because even if we require just a single configuration value per service, it will quickly be expensive in engineering hours, given the vast number of services we operate and how often such values tend to be outdated.
To solve these two problems, we’ve created the load shedder library, Cinnamon. It is built on the experiences from a previous load shedder, QALM, that was able to do graceful degradation. In addition to graceful degradation, Cinnamon dynamically and continuously adjusts the capacity of the service (using a modified TCP-Vegas algorithm, a fairly “young” idea, from 1994) and thus adjusts the amount of load shedding dynamically, depending on the incoming requests (using the PID controller idea, with origins back to the 17th century). Compared with previous approaches, Cinnamon is able to handle bigger overloads, while maintaining good latencies (P50 latency increases 50% at 300% overload). It is very efficient, generally adding only 1 microsecond of overhead per request. Lastly, Cinnamon requires no configuration, and it is being rapidly adopted by services at Uber.
This blog post is the first in a series of three on Cinnamon. The series should be interesting for everyone–from readers with no prior knowledge of dynamic load shedders to readers who have extensive knowledge. In this specific blog post we’ll give an overview of Cinnamon and see how it compares to the CoDel-based QALM. In the next two we’ll dive into how we find the rejection rate using a PID controller and how we automatically adjust the capacity using a modified TCP Vegas algorithm.
Background
Before diving into how Cinnamon is architected and works, we’ll briefly describe how QALM works. If you have already read the QALM blog post, feel free to skip this section.
QALM uses the Controlled Delay (a.k.a., CoDel) algorithm to detect overload and when overloaded it will drop low-priority requests (if any). In essence, CoDel (and thus QALM) monitors the queue of incoming requests and how much time each request spends in the queue. If they all are delayed by more than, say 5 ms, within a 100ms window, then CoDel sheds requests. For QALM, it would then reject any lower-priority requests.
At any given point, QALM limits the number of requests that are executed concurrently, which in turn acts as the capacity. As QALM is implemented in Go, the limit is implemented by inserting all requests into a channel, from which a set of background goroutines consumes up to a certain limit. Lastly, in order to use QALM, you have to configure the priority of your callers and you need to configure the maximum number of concurrent requests to be handled.
While deploying QALM, we noticed that the configuration part hindered adoption, as they require more effort than anticipated. First, just depending on the priority of your caller might not capture that a test service called your upstream service, and thus the request should really be a low-priority request (the diagram below shows this problem).
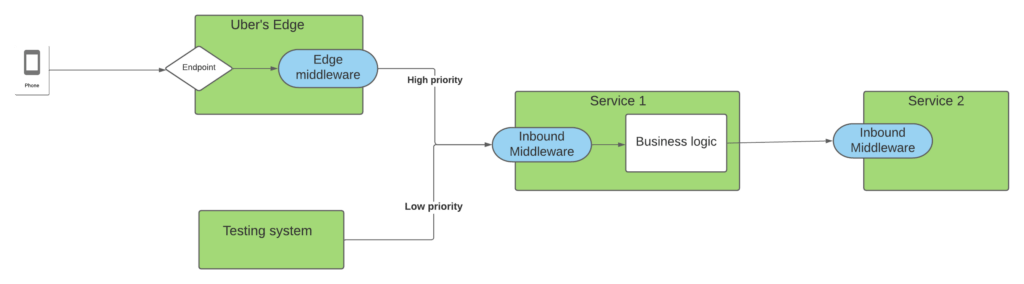
In the above, say we’re configuring the priorities in Service 2 – we might set requests from Service 1 to be high priority (as it is serving online traffic from our mobile apps). But because Service 1 is also serving test systems, it would wrongly categorize those requests in Service 2 as high priority.
In addition, setting the right maximum number of concurrent requests is difficult, as it can really change fairly rapidly depending on the request patterns your service is handling and on which hardware (and neighbors on that hardware) it is running. Further, we noticed that using channels for load shedding can be expensive, as they are points of synchronization.
Thus, we started the work on Cinnamon to fix these issues, namely:
- Better priority propagation
- Require zero configuration to use
- Make it very performant
Architecture
Cinnamon is built as an RPC middleware that is easily imported by Uber’s Go services. On top of that each request is tagged with a priority (at the edge) that is propagated down through the request stack, so that all services processing some part of the request knows how important the request is for our users. This is depicted in the diagram below:
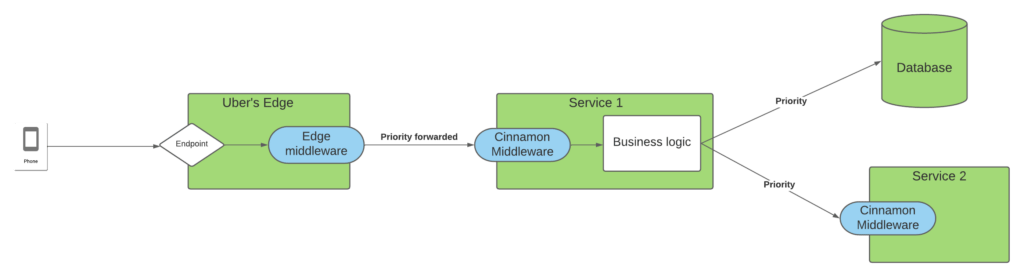
In the diagram above a request from one of our apps hits our Edge system that then forwards the request to Service 1, which as part of its processing of this request will query a database and then Service 2. The endpoint in the edge is annotated with the priority of the request and this is propagated from the edge to all downstream dependencies via Jaeger. By propagating this information, all services in the request chain will know the importance of the request and how critical it is for our users.
Having the priority annotated with each request and propagating it down through the call chain, Cinnamon is able to act autonomously for each service instance, while still able to globally agree on which requests to serve and which to reject during overloads.
Priorities
Cinnamon uses the priority attached to the request and if not present it sets a default one, depending on the calling service. The priority is actually composed of two different components, a tier level and a cohort. The tier level designates how important the request is. At Uber we use 6 tiers, from 0 to 5, where tier 0 is the highest priority and tier 5 is the lowest.
The cohorts are used to further segregate the requests within a tier, such that we can load-shed the same subset of requests across services. It is very much inspired by WeChat’s approach, where we divide the requests into 128 cohorts, based on the user involved in the request. That way, if a service needs to load-shed say 5% of its tier 1 requests, it will be the same set of users (i.e., 5%) that are load-shedded. To do so, we use a simple sharding scheme with hashing and some timing information to group and automatically shift users around, to ensure that the same users are not always shedded first. To align with tier levels, the highest priority cohort is 0 and the lowest is cohort 127.
With 6 tiers and 128 cohorts for each, we end up with 768 different priorities that we can then load-shed on. With “only” 768 different priorities, we can also build a very efficient priority queue with separate buckets for each priority.
Library Architecture
With overall Cinnamon deployment and priorities described, it is now time to dive into how the Cinnamon library is built.
The diagram below shows the life of a request as it goes through the Cinnamon middleware:
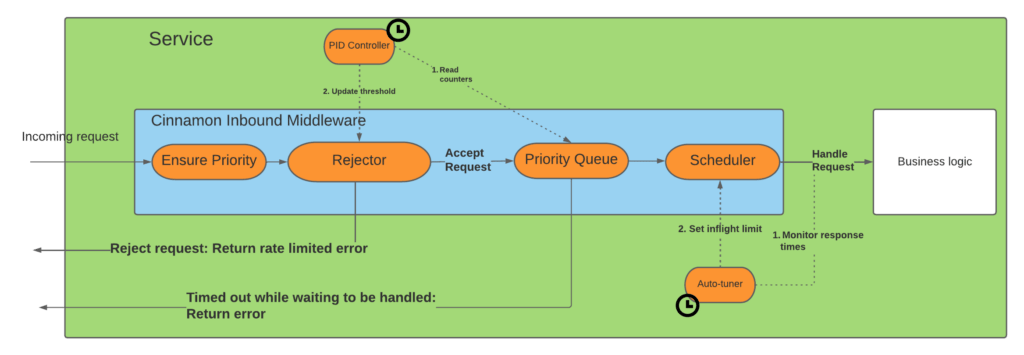
As a request comes in it goes through these stages:
- Priority: First we ensure that the request has a priority attached, and if not we set a default one based on the caller of the request.
- Rejector: Next it enters the rejector that figures out whether we should reject the request or not.
- Priority Queue: If the request is accepted it will enter a priority queue, to ensure that the highest-priority requests are scheduled first.
- Scheduler: Cinnamon only allows a fixed number of requests to be processed in parallel, so the scheduler’s job is to ensure that we process as many requests concurrently as the current limit allows, but not more.
- Timeout: In cases where too many requests are queued, they will time out from the queue and return a rate limiting error. The queue timeout is typically 33% of the normal request timeout.
Additionally, Cinnamon has two background threads/goroutines, the “PID controller” and the “auto-tuner”, that continuously adjust the rejection threshold respecting the maximum allowed concurrent requests. You might ask why we have two and can’t it all be done with just setting a correct rejection threshold, but that is unfortunately not enough. We essentially have two slightly overlapping concerns. When a service is overloaded, just controlling the maximum number of concurrent requests is not enough, as a queue might still form. On the other hand, just setting a rejection threshold does not prevent the service from being overloaded if it processes too many requests concurrently. Thus we have the two goroutines, where the PID controller’s job is to minimize the number of queued requests, whereas the auto-tuner’s job is to maximize the throughput of the service, without sacrificing the response latencies (too much).
We’ll briefly describe these two aspects below. For more in-depth information about these two, read the two following blog posts.
Rejector
The rejector component has two responsibilities: a) figure out whether an endpoint is overloaded and b), if an endpoint is overloaded, shed a percentage of the requests to make sure the request queue is as small as possible.
To determine whether an endpoint is overloaded we keep track of the last time the request queue was empty, and if it has not been emptied in the last say 10 seconds we deem the endpoint to be overloaded (inspired by Facebook).
When an endpoint is overloaded, the background goroutine starts to monitor the inflow and outflow of requests into the priority queue. Based on these numbers, it uses a PID controller to determine a ratio of requests to shed. The PID controller is very fast (as in very few iterations are needed) at finding the correct level and once the request queue has been drained, the PID ensures that we only slowly reduce the ratio. By slowly reducing the threshold we limit oscillating rates that worsen the latencies. Further, by just monitoring the inflow and outflow of requests to the priority queue, we make the PID controller agnostic to whether the service serves a high or low RPS volume.
Scheduler
If a request is accepted for processing (i.e., not rejected) it continues into a priority queue, where a scheduler pops the highest priority ones first and forwards them to the business logic inside the service that processes the request. The scheduler makes sure to only allow a certain number of concurrent requests to be processed at the same time, to better control latencies. We call this the inflight limit.
The auto-tuner background goroutine monitors the latency of the endpoint and uses a heavily modified/augmented version of the Vegas TCP/IP control algorithm to control the inflight limit. In essence, if the latency goes up it could mean the service is overloaded and thus it reduces the inflight limit. Vice versa, if latencies are stable or dropping, it will increase the limit to allow a higher throughput.
Experimental Results
To verify that Cinnamon actually works, we ran a number of experiments, including comparing it with our existing load shedder, QALM. When evaluating the load shedder, we want to test how good it is at: 1) protecting the service, and 2) protecting our core flows, by shedding low-priority requests first.
To see how well the two protect the service, we compare the throughput, which is the number of requests sent to the backend and the goodput, which is the subset of throughput that returns a successful response. Ideally the goodput should be as high as possible with minimal effect on the latencies. Furthermore, in order to protect our core flows, the load shedder should ideally shed lower-priority traffic before any higher-priority traffic.
In all cases, we use a test service that has an endpoint that does a mix of memory allocations, CPU work (sorting) and rescheduling (via a time.Sleep) to mimic a real-life workload. The response time of the endpoint is around 120ms when not loaded.
We run tests of 5 minutes, where we send a fixed amount of RPS (e.g., 1,000), where 50% of the traffic is tier 1 and 50% is tier 5. Each request has a timeout of 1 second. We collect the P50 and P99 latencies and goodput. In all cases, we run in production, where we have two backend instances and are hitting them from two other machines. Each backend has a capacity of ~650 RPS, so in total the service can handle 1,300 RPS.
Goodput
The first to estimate is the goodput, which is essentially the <throughput> * (1 – <error-rate>), where error-rate is both rate-limiting errors and timeouts. We group by tier and include the error rate to make it easy to compare (we’ve added a baseline case, with no load shedders enabled).
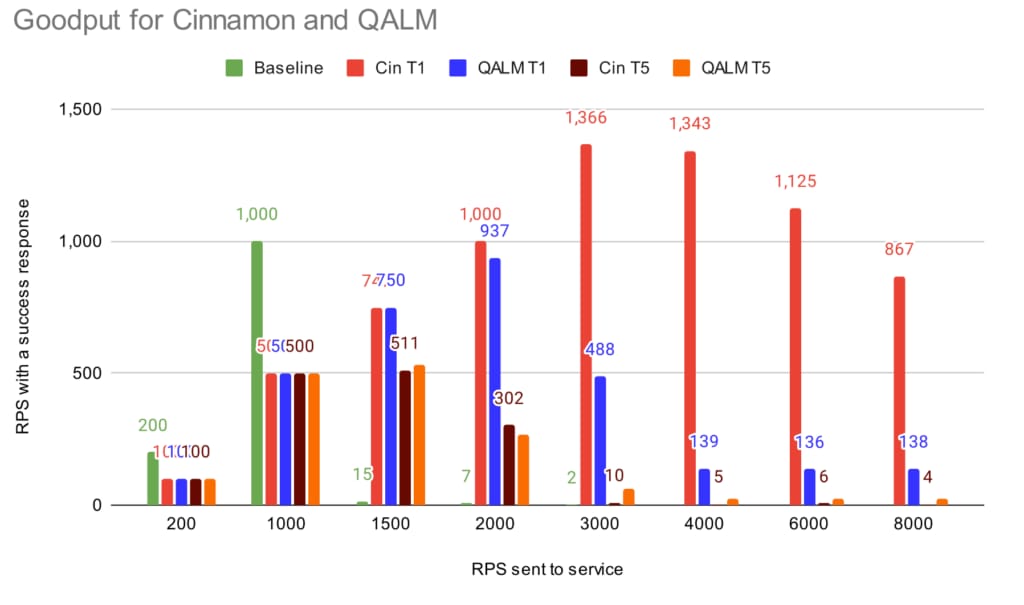
To get the total goodput for one of the load shedders, you can just add the goodput for tier 1 and tier 5 (e.g., in the 2,000 RPS case, Cinnamon’s goodput is 1,000+302=1,302). As the sending of the traffic happens from two different machines, some of the tier5 goes through, because the two machines are not fully synced when to start the experiment. For the baseline case (i.e., no load shedder), when sending more than 3,000 RPS to the service it dies, and no requests go through.
As can be seen, when the service is not loaded (200-1,000 RPS), all requests go through. When we hit the 1,500 RPS case, both load shedders kick in, where QALM keeps a slightly higher goodput (~2% higher), compared to Cinnamon (1,258 vs. 1,280). This is likely because the auto-tuner has to find the right inflight limit combined with noise in our production environment.
At 2,000 RPS and above, Cinnamon sustains goodput close to the capacity. Do note that at the higher throughput cases, the service is spending more and more resources rejecting requests, and thus the capacity of the service goes down. QALM on the other hand starts to error out on tier 1 requests as well (most of them are timeouts), and at 3,000 RPS, its total goodput is at 552, or 40% of the capacity of the service.
Latencies
While goodput is one thing, it’s another thing entirely whether the latencies are good. The graph below shows the P50 and P99 tier 1 latencies (which are the ones we really care about):
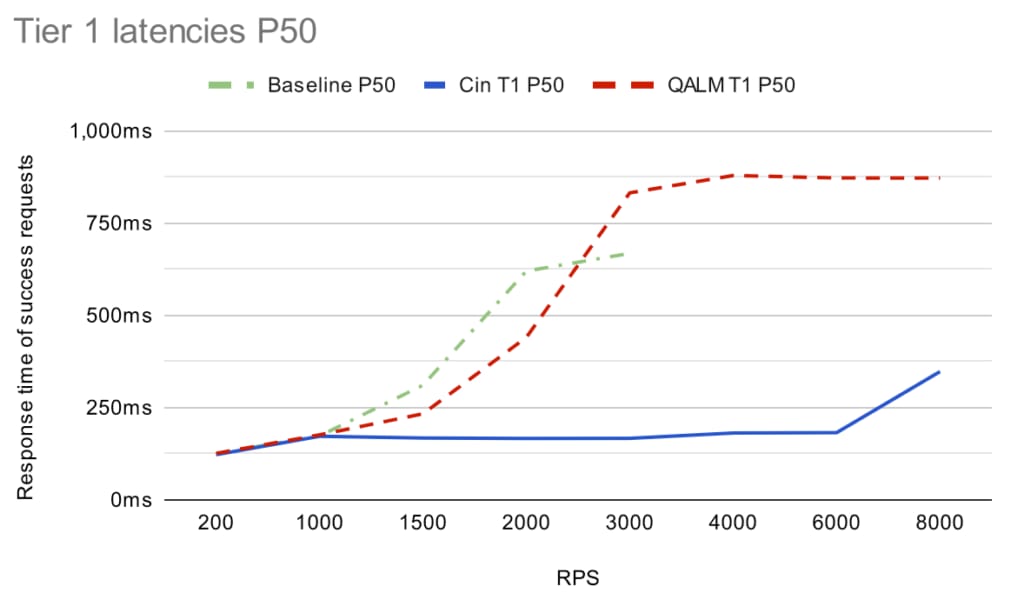
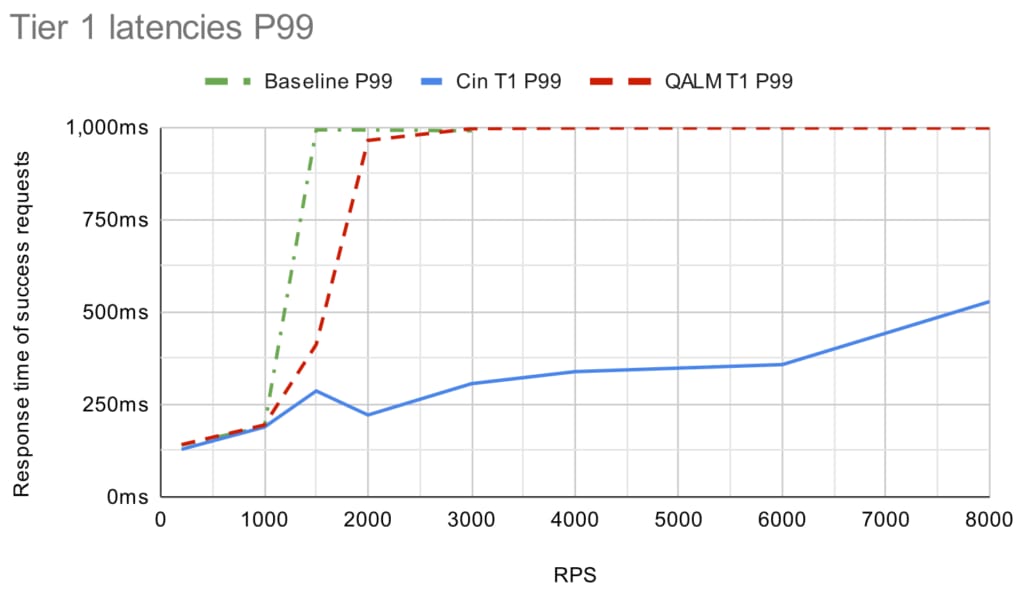
(Note that after 3,000 RPS the service is completely dead without a load shedder, so we don’t have any baseline points after that).
Under light load, the P99 is at ~140 ms for all and it increases to ~190 ms when the system is fairly loaded (1,000 RPS). Going above the capacity limit (1,500 RPS+) both load shedders kick in, but the latency profile starts to diverge. QALM fairly quickly approaches the timeout limit of 1 sec (for both P50 and P99), whereas Cinnamon stays below 500ms (with P50 of ~180 ms). Note that the latency distribution looks similar for tier 5.
The big difference for these cases is that the PID controller in Cinnamon is able to sustain a good rejection rate, so you avoid oscillating between rejecting everything and then rejecting nothing (which CoDel tends to do). Further, at high throughput cases, the service is so loaded that CoDel believes all requests are delayed, so it rejects almost every request (and this is only amplified by using a single Go channel).
We can actually see this fluctuation of the rejection ratio if we zoom in on one of the RPS cases. The graphs below show the success and error rate along with success response times for Cinnamon and QALM in the 4000 RPS case (for reference, we have included a 2-minute baseline run of 700 RPS).
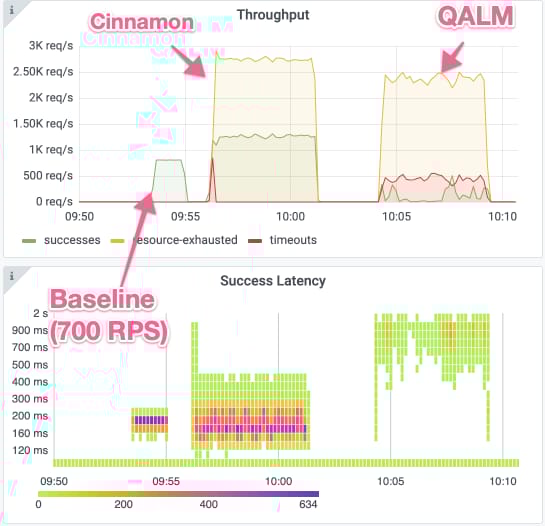
As can be seen, the rejection rate (yellow line) is fairly stable for Cinnamon (with a bit of timeouts in the beginning due to queues), whereas QALM consistently returns timeouts, where both success (green line) and rejection rates fluctuate (e.g., success rate goes from ~0 to 500).
Interaction Between PID and Auto-Tuner
Another interesting aspect is how the PID controller and the auto-tuner interact. To see this we look at the 1,500 and 2,000 RPS cases, which the following heatmaps show. The top graph shows how the inflight limit moves, while the bottom one shows rejection rate.
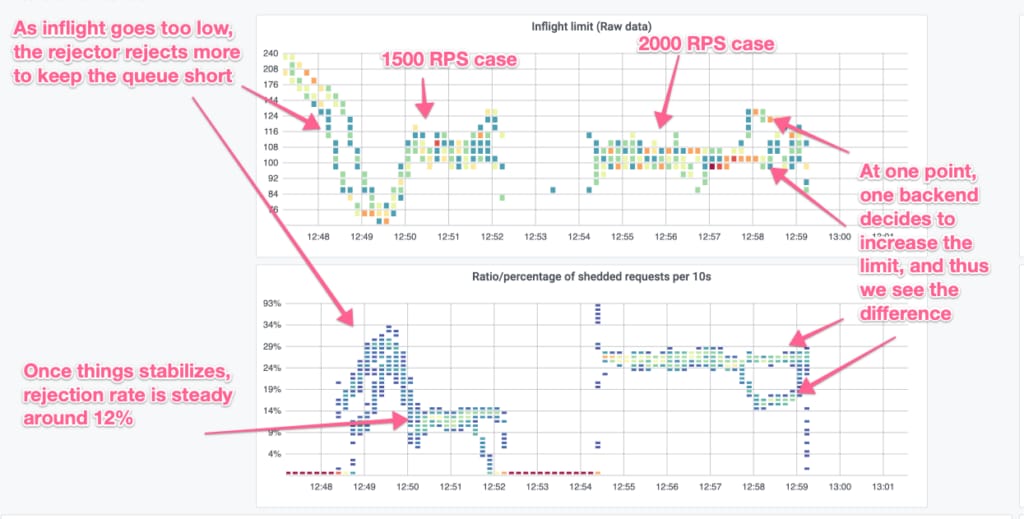
Initially for the 1,500 RPS case, the inflight limit is ~240 which then drops to ~60 and then stabilizes around 110. This takes a few minutes for the auto-tuner to adjust. Meanwhile, as we’re sending 1,500 requests to it, there is a request-queue build-up and the rejector kicks in. As the auto-tuner adjusts the inflight (and thus the goodput), the rejector adjusts to make sure the queue is as small as possible.
On the other hand for the 2,000 RPS case, the inflight limit is already at 110, so it does not need to adjust, as it stays there. Correspondingly, the rejector keeps a steady rejection rate of ~30%.
Summary
With Cinnamon we have built an efficient load shedder that uses century-old techniques to dynamically set thresholds for rejecting and estimating capacity of the services. It solves the issues we noticed with QALM (and thus any CoDel-based load shedder), namely, that Cinnamon is able to:
- Quickly find a stable rejection rate
- Automatically adjust the capacity of the service
- Be used without setting any configuration parameters
- Incur very low overhead

Jakob Holdgaard Thomsen
Jakob Holdgaard Thomsen is a Principal Engineer at Uber, working out of the Aarhus office, helping to make Uber's systems more performant and more reliable.

Vladimir Gavrilenko
Vladimir Gavrilenko is a Software Engineer at Uber on the Inventory and Catalog team based in Aarhus, where he focuses on reliability and scalability.

Jesper Lindstrom Nielsen
Jesper Lindstrom Nielsen is a Staff Engineer at Uber on the Inventory and Catalog team based in Aarhus, trying to make everything run a bit faster and scale a bit more.

Timothy Smyth
Timothy Smyth is a Staff Engineer at Uber on the Delivery Backend Platform team based in New York City, helping to increase the resilience of Uber Delivery.
Posted by Jakob Holdgaard Thomsen, Vladimir Gavrilenko, Jesper Lindstrom Nielsen, Timothy Smyth