Новые данные о переходе на электромобили
Q3 2025 update: This page includes metrics for trips completed on Uber by internal combustion engine vehicles and zero-emission vehicles (ZEVs, such as battery EVs) from the beginning of the first quarter of 2021 to the end of the third quarter of 2025. Note that the scope of this report includes only Uber’s Mobility business (ridesharing).
Как мы отслеживаем наш путь к нулевым выбросам
Five years into our ambitious efforts to transition to a zero-emission platform, we’ve made meaningful progress. Today, Uber is the world's most widely available platform for zero-emission rides, with drivers adopting EVs (electric vehicles) up to 5 times faster than average motorists in the US, Canada, and Europe.
We’ve invested hundreds of millions of dollars to help interested drivers make the switch to electric through incentives, partnerships, and product enhancements—and it’s paying off. Increasingly, riders are experiencing their first EV on Uber, helping to normalize and accelerate the adoption of electric transport all over the world.
Our data shows that EV progress quickens when government and industry work together to get the economics right. In cities like London, Vancouver, and Amsterdam, where thoughtful policies, industry investment, and strong charging networks align, more than 1 in every 3 miles on Uber are now electric.
Despite this significant progress, major barriers remain to fully achieving our goals. High upfront EV costs, limited charging access, and inconsistent policy support continue to slow adoption. Based on current trends, we cannot meet our remaining mobility and delivery goals for 2025, and our 2030 goals will be out of reach without stronger, coordinated action across government and industry.
As we’ve said from the start: Climate is a team sport, and progress depends on collective action. That’s why we’re increasingly prioritizing efforts in cities where public and private investment are aligned.
While many key levers are outside our control, we remain deeply committed to this transition—not just because it’s the right thing to do, but also because it brings direct and strategic business benefits. Thousands of drivers around the world are taking home more money thanks to lower EV operating costs and rider demand for electric vehicles. Riders report higher satisfaction with the EV experience and are increasingly choosing EVs.
And finally, the future is shared, electric, and autonomous—and the coming wave of autonomous (electric) vehicles will create a major tailwind in achieving our sustainability goals.
Our latest update below outlines the progress to date, key insights, and areas of focus for 2025 and beyond.
Водители автомобилей ZEV
Globally, more than 286,000 ZEV drivers were active on Uber’s app in Q3 2025. That’s over 57% more than the same period a year earlier.
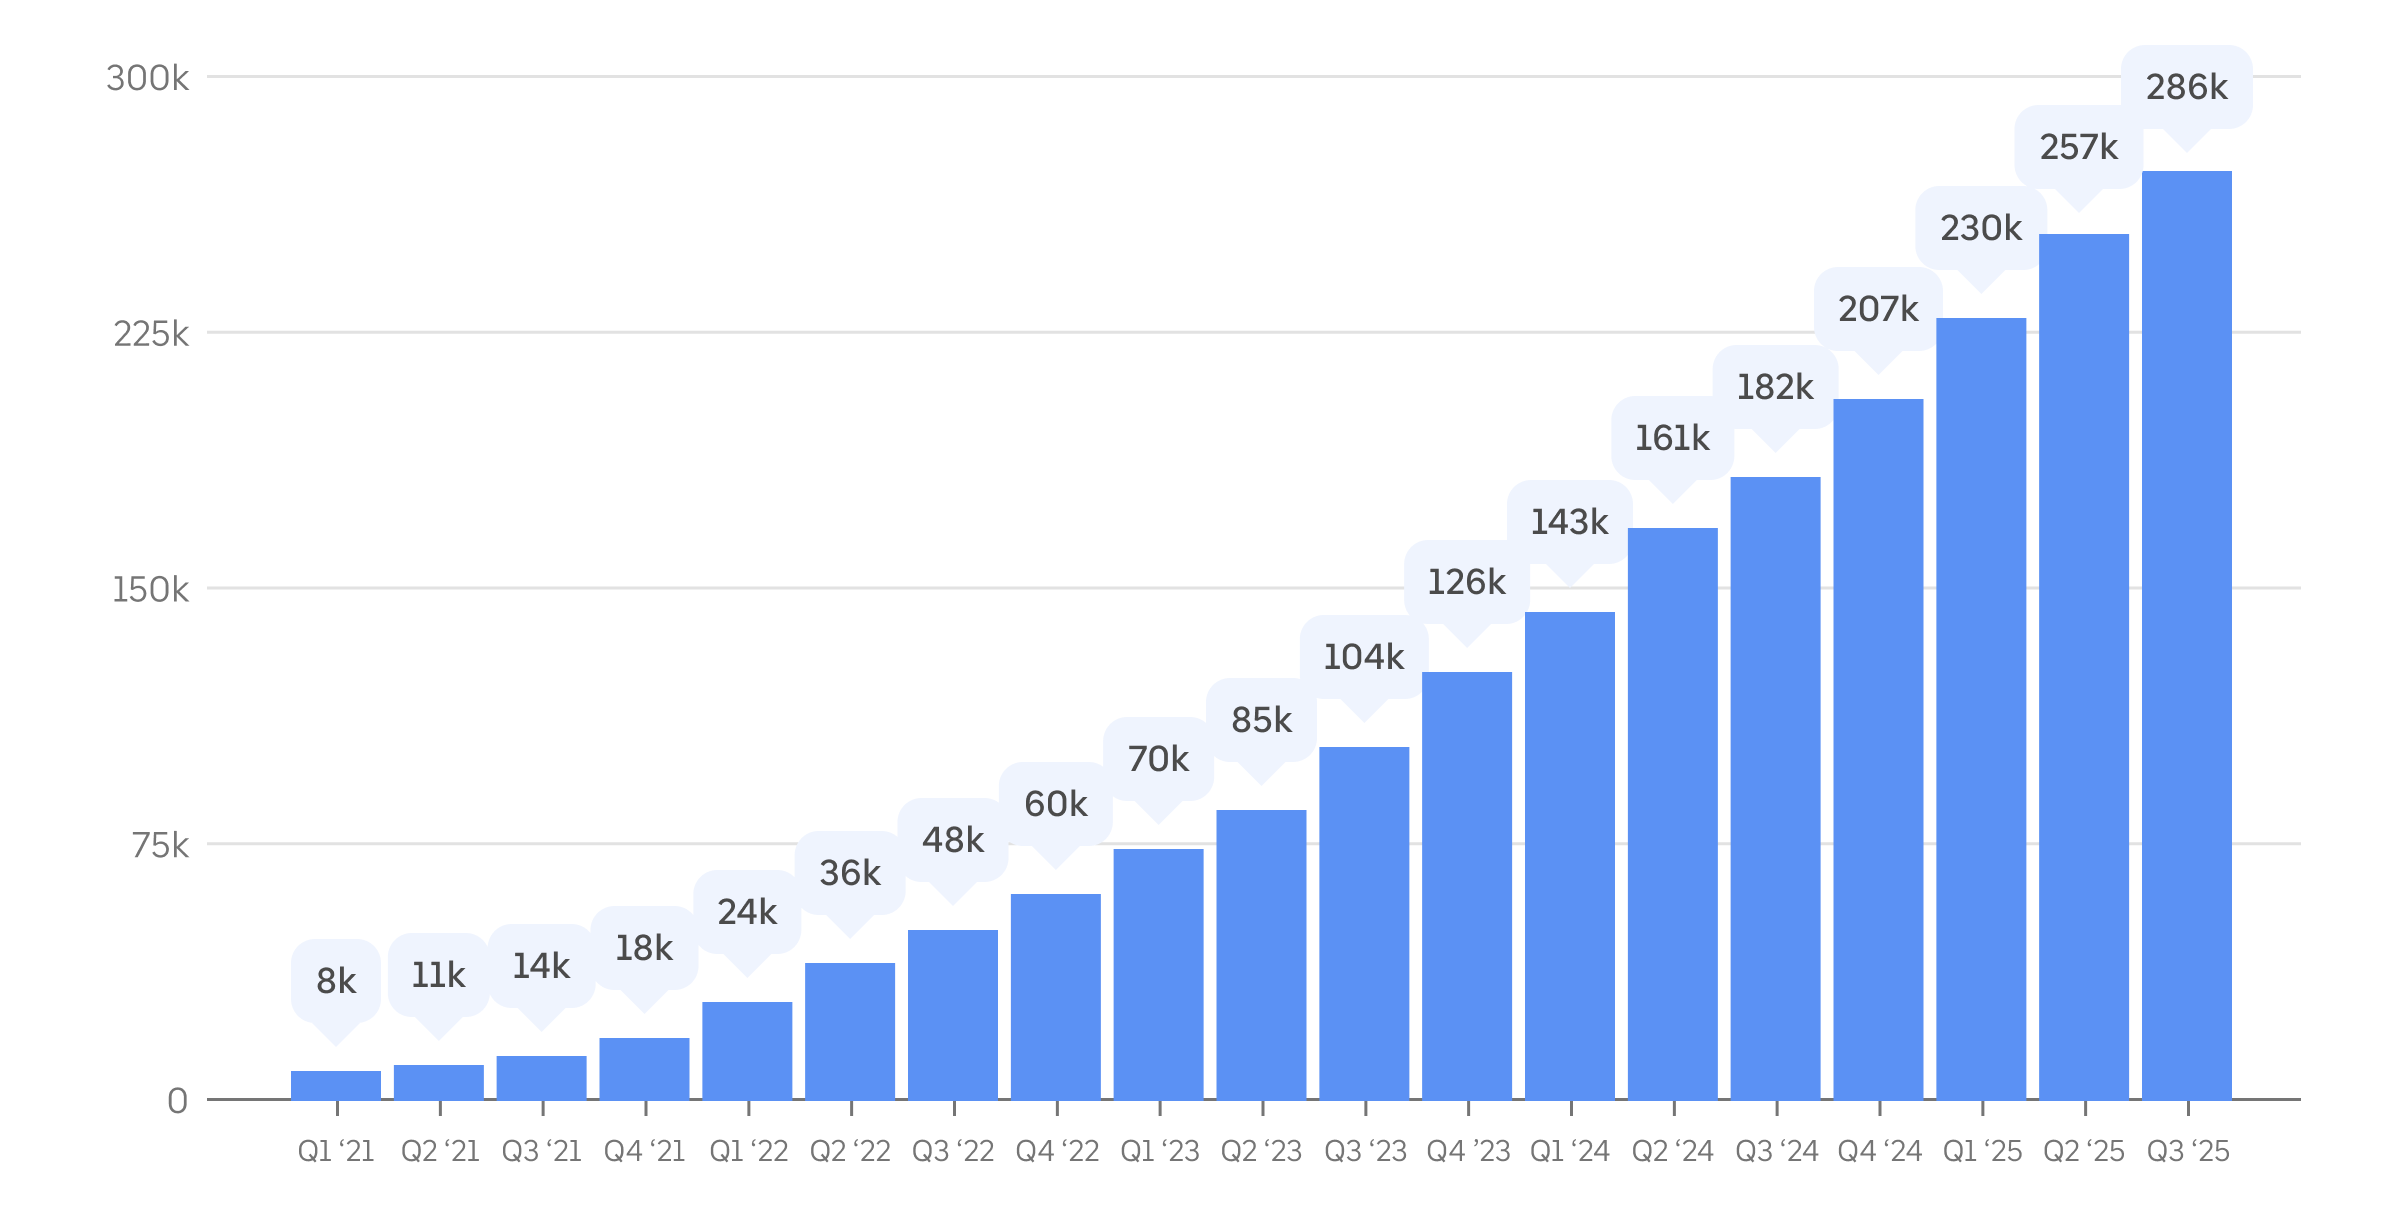
Показатель: среднемесячное количество в�одителей ZEV на платформе Uber по кварталам, с I кв. 2021 г. Водители считаются активными на платформе Uber, если они выполнили хотя бы одну поездку в течение календарного месяца.
Поездки на автомобилях ZEV
In Q3 2025, ZEV drivers completed over 136 million trips using Uber, globally. That’s more than 17 ZEV trips on Uber every second, on average. The Q3 2025 total is 60% more than the number of ZEV trips completed on Uber during the same period a year earlier.
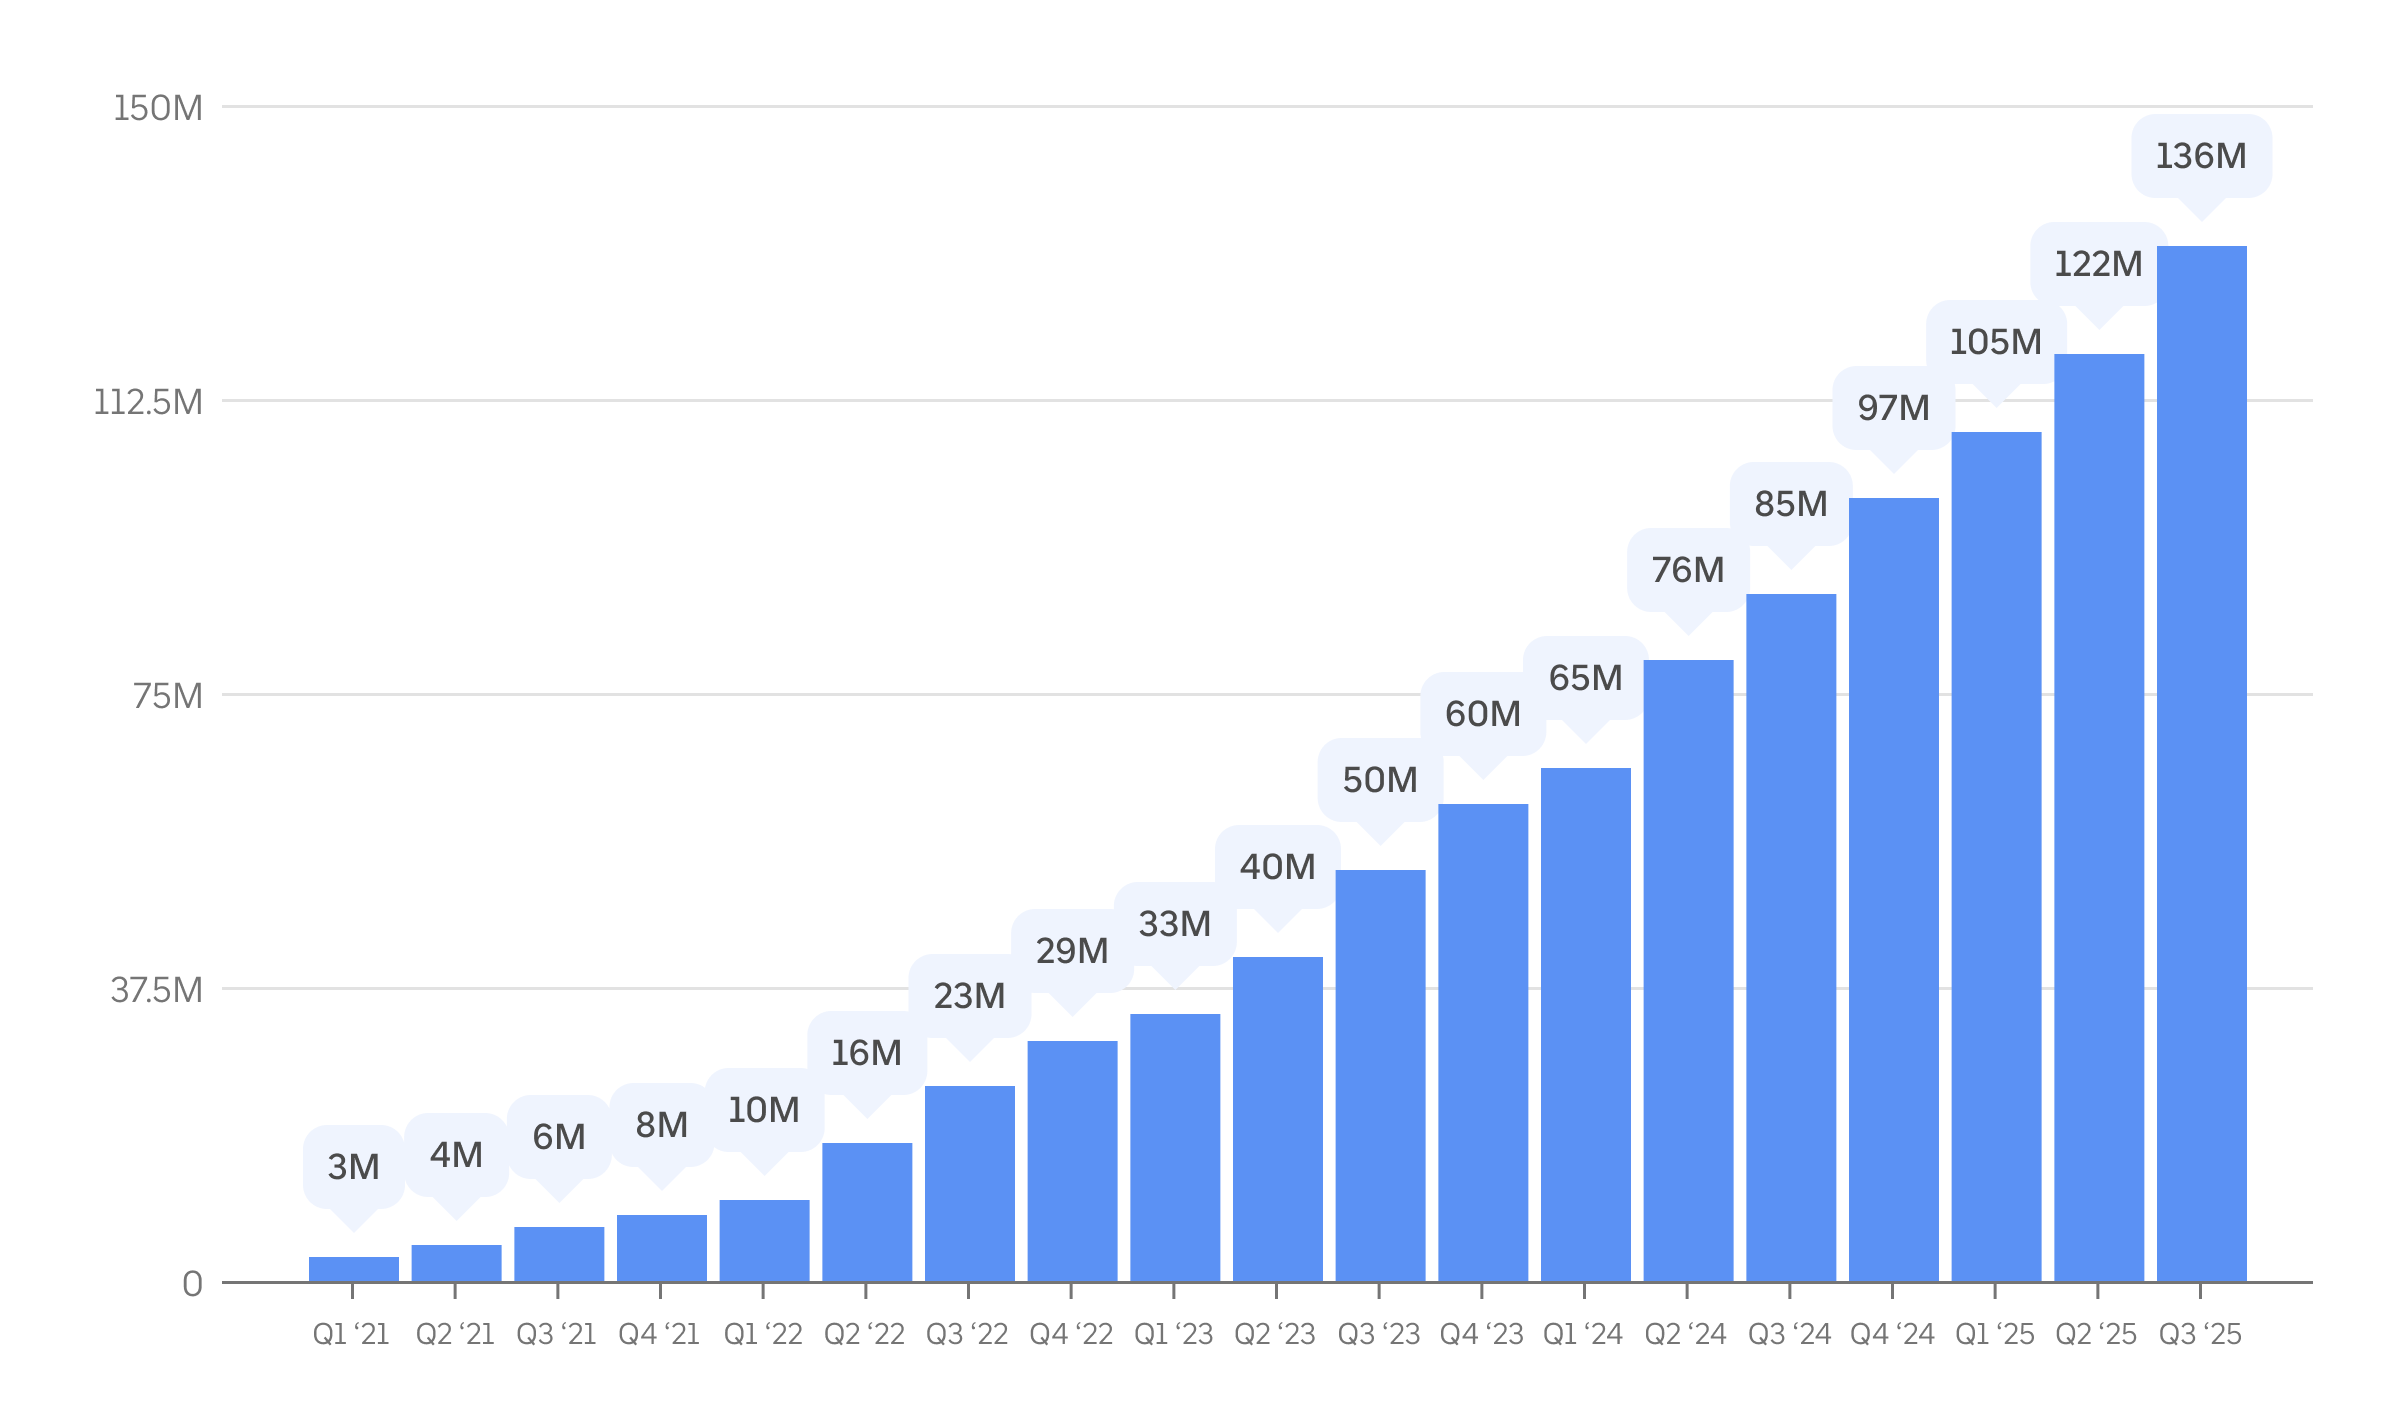
Показатель: количество поездок, выполненных на платформе Uber водителями автомобилей ZEV (поквартально, начиная с I кв. 2021 г.).
Популяризация автомобиле�й ZEV
In Q3 2025, ZEV drivers completed 16.8% of all on-trip miles in Europe and 9.5% of all on-trip miles in Canada and the US—adoption levels many times above drivers in the general public.
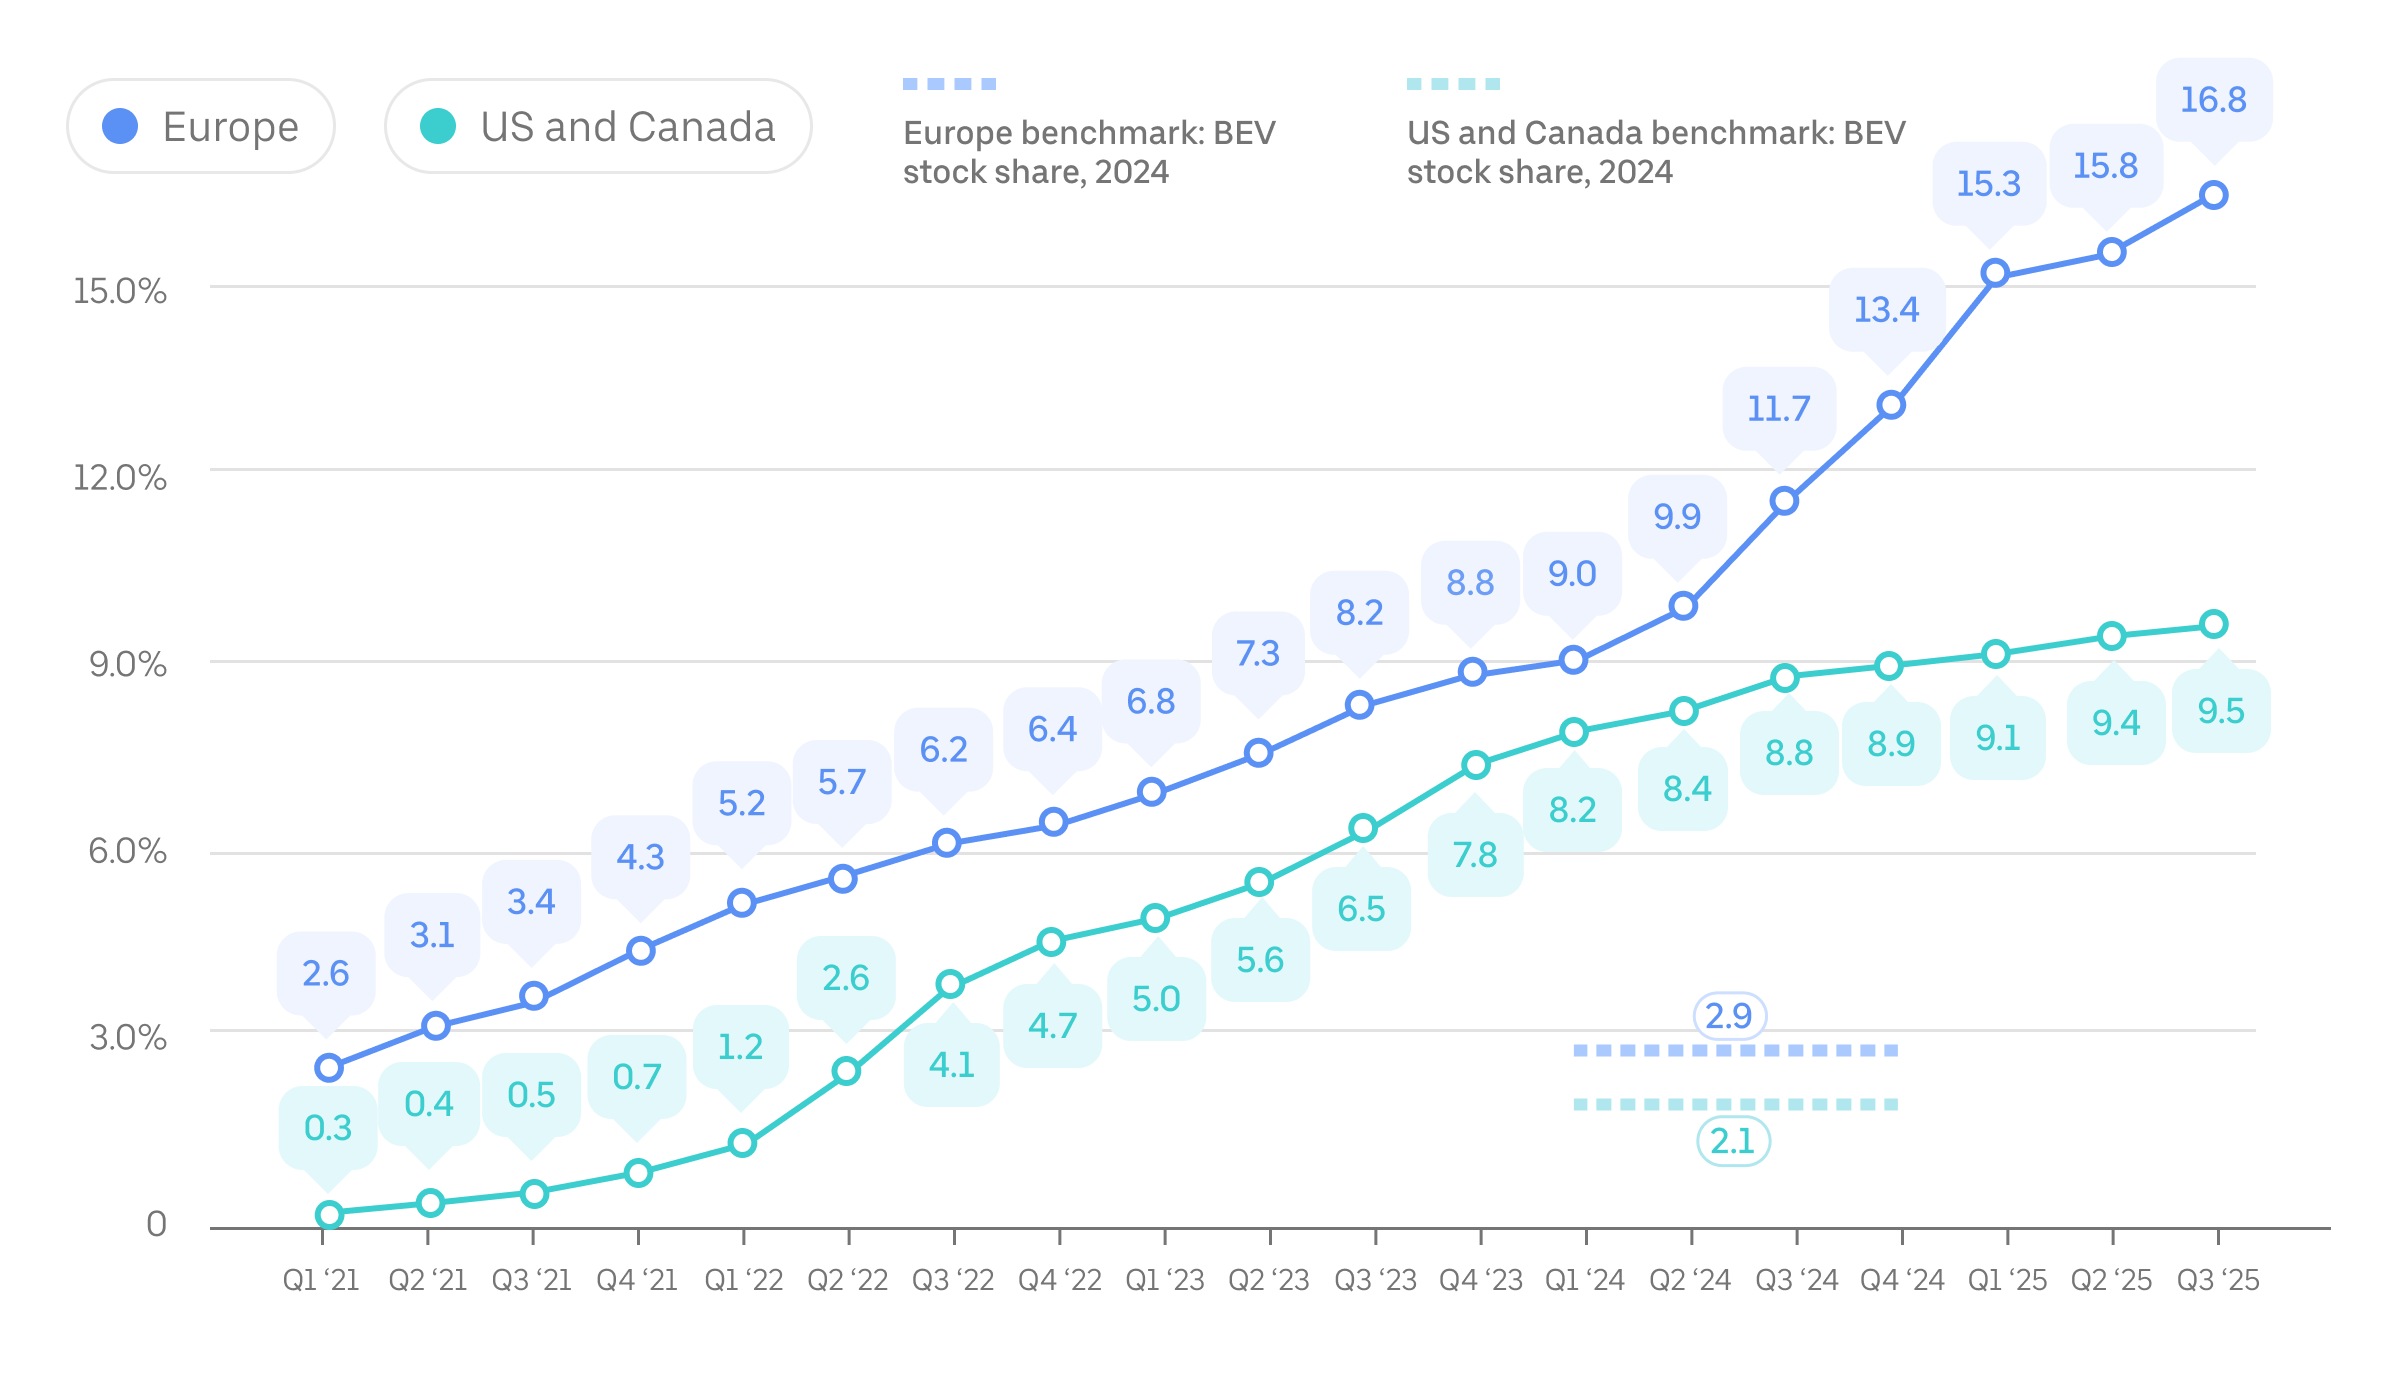
Metric: Share of on-trip miles completed in ZEVs compared with all on-trip miles arranged by the Uber app, by quarter since Q1 2021. Canada, US, and Europe benchmark data is as of 2024 (the most recently available at the time of this update) and is sourced from the International Energy Agency. “BEV” refers to battery electric vehicles.
Углеродоемкость пассажироперевозок
В 2024 году на каждую милю поездки одного пассажира с Uber приходилось в среднем 197 г выбросов CO₂ в Европе (123 г/км) и 340 г выбросов CO₂ в США и Канаде (212 г/км). По сравнению с 2021 годом этот показатель снизился на 14% в Европе и на 15% в США и Канаде.
С 2023 по 2024 г. углеродоемкость поездок с Uber немного выросла из-за незначительного снижения среднего количества пассажиров в автомобиле и увеличения пустого пробега (пути, проделанного межд�у поездками с пассажирами на борту).
Metric: Passenger carbon intensity, or the estimated grams of CO₂ per passenger mile traveled, is an annual efficiency metric used by Uber—and, increasingly, governments and companies around the world. In the case of ridesharing, or any on-demand mobility service, emissions produced by any deadhead miles are factored into the calculation.
For more details about how we calculate passenger carbon intensity, go to our methodology document. Note that significantly lower average fuel economy for vehicles on Uber in Europe versus the US and Canada explains most of the difference in carbon intensity in these 2 geographies. While the composition of vehicles that drivers use on Uber’s app in Europe is more efficient (with a higher proportion of ZEVs and hybrids), more-stringent fuel economy reporting standards in the US also contributes to this discrepancy. In addition, we lack access to sufficient input data to calculate passenger carbon intensity for trips completed in European markets before 2021.
Аналитика и статистика
Say hello to Uber Electric (2025)
Electrifying ridehail in the US and Canada (2025)
EVs for everyone: balanced adoption of a maturing technology, статья, 2024 г.
Экологичные поездки — это выгодно (2024 г.)
How to help spark electric mobility across Europe, статья, 2024 г.
Сокращение выбросов за счет оптимизации маршрутов (2023)
Оценка эффективности транспортных средств с учетом показателей углеродоемкости (2019 г.)
Часто задаваемые вопросы
- Что входит в обновление данных по электрификации?
Наш отчет о переходе на электромобили содержит данные об углеродных выбросах и электрификации пассажирских поездок на платформе Uber. Он будет интересен всем, кто занимается вопросами экологии.
- Зачем вы публикуете это обновление?
В это обновление вошла статистика реального использования нашей платформы мобильности. Она поможет вам составить объективную картину об усилиях, которые мы прилагаем на пути к электрификации, а нам — работать в этом направлении еще эффективнее.
- Какие ключевые показатели вы используете для оценки перехода на электромобили?
Мы применяем следующие показатели:
- Использование водителями автомобилей с нулевым выбросом для поездок с Uber (доля ZEV от общего пробега в км/милях). Позволяет оценить динамику движения компании Uber к цели стать глобальной транспортной платформой с нулевым уровнем выбросов к 2040 г.
- Углеродоемкость пассажироперевозок — объем выбросов на одну милю/км поездки.
- Как эта информация поможет снизить выбросы и увеличить долю электромобилей на платформе Uber?
Мы поставили перед собой амбициозные цели: снизить уровень углеродных выбросов от пассажирских поездок и увеличить долю автомобилей с нулевым уровнем выбросов. Сбор и публикация связанной с этим статистики — важный шаг на пути к достижению цели.
- Совершают ли пассажиры поездки с Uber вместо того, чтобы использовать альтернативные возможности с более низким уровнем выбросов, например общественный транспорт?
Поездки, заказанные через приложение Uber, — это лишь один из многих способов передвижения, доступных пользователям. Набор услуг зависит от специфики рынка. Произведя анализ данных, полученных в рамках Национального опроса о путешествиях среди домохозяйств США, мы обнаружили, что растущая популярность самых экологичных способов передвижения (на общественном транспорте, пешком и на велосипеде) коррелирует с более широким использованием платформ совместных поездок и других решений по запросу.
- Будете ли вы оценивать аналогичные данные для других стран и регионов мира?
Many of the above metrics now cover all passenger trips completed with the Uber app globally. We regularly report on carbon emissions and other impact areas resulting from trips on Uber.
- С какой частотой вы планируете обновлять данные по электрификации?
Мы обновляем показатели не реже одного раза в год, а некоторые из них чаще. Публикация совокупных показателей по вредным выбросам за календарные годы (углеродоемкость поездок и пр.) выполняется ежегодно.
- Что означает термин «автомобиль с нулевым уровнем выбросов»?
We use the term “zero-emission vehicle” (ZEV) the same way the California Air Resources Board (CARB) and Europe’s Transport & Environment (T&E) do: to refer to vehicles that produce no direct CO₂ emissions or other criteria air pollutants (such as NOx, particulate matter, CO₂, and SOx) from the on-board source of power. Regional variations should be considered at the reader’s discretion.
Drivers using Uber’s app use 2 types of ZEVs today: battery electric vehicles (battery EVs) and, very occasionally, hydrogen-powered fuel cell electric vehicles (FCEVs).
Of course, the “zero” in ZEV refers to no emissions from the proverbial “tailpipe” of the vehicle and not necessarily all the emissions that can be accounted for from production to disposal of the vehicle and its energy source. All accounted for, however, life-cycle analyses by independent experts show that “emissions over the lifetime of average medium-size battery EVs registered today are already lower than comparable gasoline cars by 66%–69% in Europe, 60%–68% in the United States, 37%–45% in China, and 19%–34% in India.”
- Собираетесь ли вы оценивать влияние на экологию услуг доставки?
Our Electrification Update currently covers electrification and emissions metrics only for our Mobility business (ridesharing). We aim to include our progress on delivery emissions and electrification in the future.
In terms of packaging, Uber continues to invest in helping merchants transition to sustainable options. As with electrification, however, progress depends on collective action. We’re prioritizing efforts in cities where public and private investments are aligned. For example, in France over 60% of packaging used on the platform is recyclable, reusable, or compostable, supported by national policy and local incentives.
While progress has been made, based on current trends we cannot meet all 2025 goals, and our 2030 goals will be out of reach without stronger, coordinated action across government and industry.
While many key levers are outside our control, we remain deeply committed to this transition. To learn more about Uber’s approach to more-sustainable packaging with merchants, consult our Uber Eats for Merchants web page.
- Публикует ли Uber информацию о выбросах 1-й, 2-й и 3-й категории? Если да, то где ее можно найти?
Uber discloses Scope 1, 2, and 3 emissions in our Governance Strategy and Engagement Report and to CDP. You can find our most recent score in CDP’s public corporate score search. These emissions estimates have received limited assurance from an independent third party.
This page and the related information, updates, reports, and web pages (the “Report”) contain forward-looking statements regarding our future business expectations and goals, which involve risks and uncertainties. Actual results may differ materially from the results anticipated. Additionally, this Report is provided for informational purposes only and should not be relied upon for business or vehicle acquisition decisions. Undue reliance should not be placed on the forward-looking statements. We undertake no duty to update this information unless required by law. For more information on Uber’s strategy, please go to investor.uber.com.
Certain data disclosed in this Report has received limited assurance from LRQA. Data discrepancies with assurance may be present due to rounding methodologies.
The use of terms in this Report such as “drivers,” “couriers,” “earn,” “zero- emission vehicle,” and “sustainable packaging” are general and follow the general use case of the words by Uber Technologies, Inc. Regional variations of words should be considered at the reader’s discretion.
An overview of Uber's use of carbon offsets can be found here.
О сервисе
О сервисе